
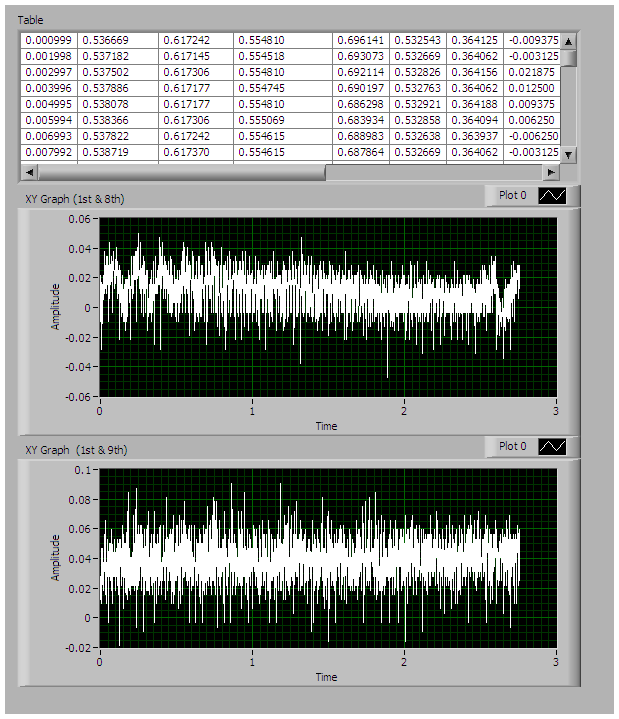
Hi, I am Avinash, I have ASCII code in EXCEL file with huge data like 60000rows and 9columns. We need to plot graph between 1st column and 8th column , 1st column and 9th column. It should read from 23rd row onwards... after that, It should plot in saparate graphs and have to find the maximum and minimum values of each pulse of the waveform in each graph and should count the pulses in the graph..... I am new to this LABVIEW, please kindly help for my project. This is the final stage of my projec