

mathilde38
-
Posts
5 -
Joined
-
Last visited
-
Days Won
1
Content Type
Profiles
Forums
Downloads
Gallery
Posts posted by mathilde38
-
-
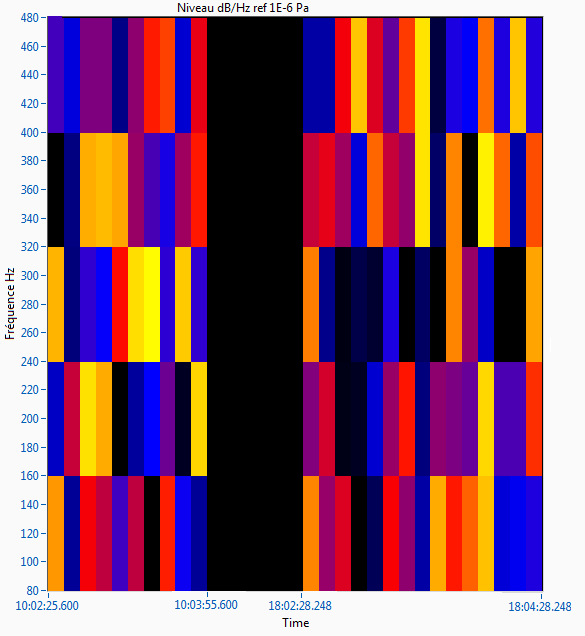
Because there may be several hours of discontinuity, for just few seconds of interesting signal, and my customer don't want to see these "black" zones. He wants to see at a glance all the interesting zones.
-
Hi
I' d like to display an intensity graph with a non linear and non regular X-scale, in other words an X-scale with time dicontinuities (see image in attachment).
I have a solution by adding a slide above the X-scale, but as I have to manage cursors, is' not very easy.
I'd like to know if someone has a better solution...
Thanks in advance
Mathilde
-
Cross posted from :
http://forums.ni.com...ht/true#M702675
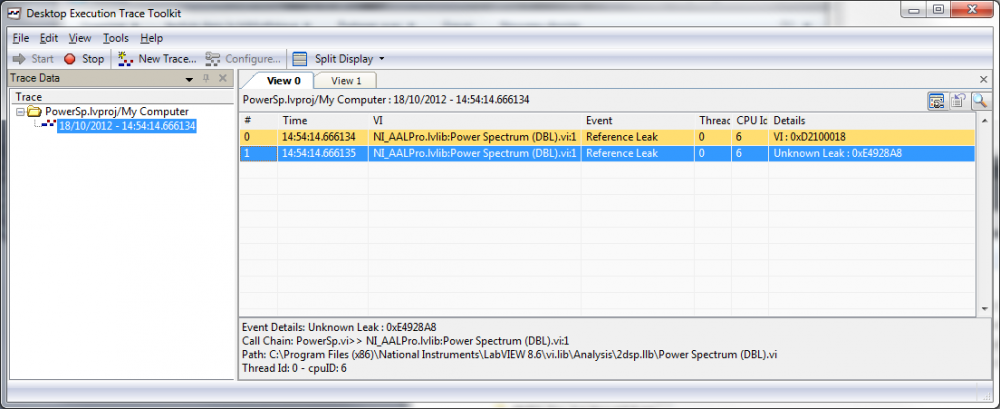
Hi
I have a memory leak on my application. By observing with the "Desktop Execution Trace Toolkit", the Power Spectrum function (from NI_AALPro.lvlib) seems to have two "Reference leak".
The first one refers to the function "Open VI reference"; I got around this problem by replacing the "Open VI reference" by an "Initialize" input boolean, but I don't understand the second memory leak.
Any idea ?
Thanks...
(See attachments : Desktop Execution Trace + code)
LV8.6.1 + Desktop Execution Trace Toolkit 2009
Same problem with LV2012 + Desktop Execution Trace Toolkit 2012
-
- Popular Post
- Popular Post
This window can be called by a CIN code, by using the function
DbgPrintf("Value to debug : %d", value);
Is is very useful to debug CIN functions.
It is defined in the /LabVIEW folder/cintools/extcode.h
-
 4
4

Custom probes
in Announcements
Posted · Edited by mathilde38