

Daryl
-
Posts
179 -
Joined
-
Last visited
-
Days Won
1
Content Type
Profiles
Forums
Downloads
Gallery
Posts posted by Daryl
-
-
On 10/23/2017 at 7:43 AM, Nishar Federer said:
Hi,
Can anyone suggest me a way to add the hexadecimal string to the notepad file ? Because currently i am getting only junk characters .
Oh man, you mean to tell me I KNEW ABOUT THIS A FEW YEARS AGO and forgot about it? LOL, sucks getting old!!!!
I will try your fix and see what happens, thanks!!
-
Labview 2016 XNET signal control does not fire change event. Is this a known issue?
-
On 4/25/2016 at 11:35 AM, ensegre said:
You mean a typedefd one, I guess. I'm seeing that in LV15 all plain cluster BD constants turn into small icons.
One could argue that if it was, it would be a non-self understood custom BD glyph. At that point, would a subVI with a custom small icon and providing the constant cluster output, be an acceptable workaround?
Actually yes. This is a good idea -thanks.
(I don't know why I didnt think of it
 )
)
-
Is it possible to make a cluster icon small (on the block diagram) like the error constant when you select "View Cluster as Icon"? Doing it the same way as a regular VI does not work.
-
It also happens with the waveform datatype, so it is not exclusive to the Dynamic data type.
-
This one is driving me nuts.
Add digital display to Waveform Graph and the digital display will intermittently spike to 0 even though the data feeding it does not. The plot on the graph will actually spike to 0 also but it does not always drop when the digital display does. For some reason the example I have attached does not show the issue on the plot, only the legend digital display, but it does happen on the application I am working on.
The Waveform Array indicator does not display this same behavior.
What am I dong wrong here?
Using Labview version 2014
If you change the loop rate to 200ms it is much easier to see
-
I have to send 1 diagnostic request (CAN Frame) within a few milliseconds of an analog trigger to reproduce an issue. I am not trying to use this as a timing mechanism for a periodic message. The work around VI I posted does what I need it to do but I was wondering if this was some kind of issue.
-
So the 1st time you write a frame to the function "XNET Write (Frame CAN).vi", it takes about 16ms for the function to write to the bus. Subsequent calls to this function will not have this delay.
Is this a known issue? Is it a handy feature of this function? Or am I just doing it wrong (this is usually the case)?
Please see the attached VI's and let me know what you think. (Labview 2014, XNET 14.0)
Thanks.
-
bbean - thanks for the help! I was able to get remote panels to work with Firefox by following the instructions in this link you provided.
http://digital.ni.com/public.nsf/allkb/CF91AE26198992A686257B79006959C0
Thanks again!
-
Thanks for the reply. I will try those tricks for Firefox and if they dont work, I will try Opera. I just need this to work for 1 simple demo and I will never have to worry about ti again.
-
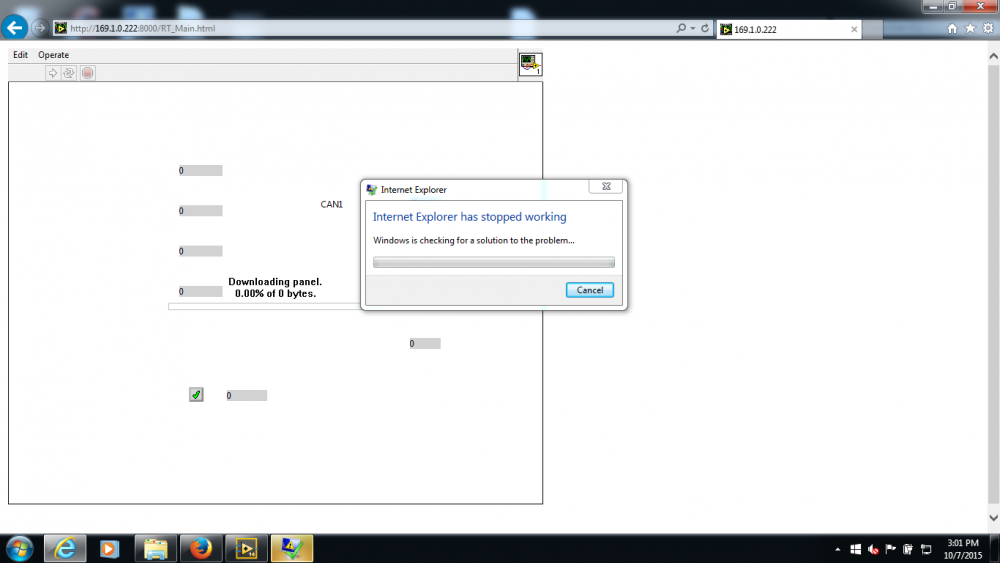
I'm trying to open a remote panel in Internet Explorer from a cRIO-9014 running Labview 2014. Whenever I try to connect, the panel begins to open then IE crashes (see attached image). I have tried using Firefox and I get a message "plugin needed" but I have the latest plugin installed.
Any ideas how to get either browser to work for remote panels? I'm at the end of my rope with this one.
Also - I have tried from 2 different computers on the network with the same results so I assume it is a problem with my real time web server configuration?
-
Thank you for your help and ideas. I have come up with a similar solution by polling the value and if it is changes, write the new value to the Value(signaling) property. It's kind of ugly but it will work for now.
I just got an e-mail from NI Applications Engineer and there is a CAR #426378 for this issue.
-
I just tried this as far back as Labview 8.5 and the issue existed even in that version. It is only an issue with the "NI Terminal" control. I have tried with DAQmx Global cannel control and DAQmx Physical Channel control and the events are fired from the "browse" menu as expected. I contacted my local Rep and he is escalating the issue.
I'm struggling to come up with an easy work around in the mean time.
I guess I can poll the value for changes in the timeout case of the event structure. This is the least "ugly" solution I can think of for now.
-
Please look at the attached Labview 2014 vi.
Press the arrow on the control and select a different value from the drop down list and the event is fired as expected. Now, press the arrow, then click on "browse" and select a different channel, the event does not fire. Is this a bug in Labview? Is there a workaround to get the event to fire?
-
I just stumbled across this and it brought back some memories from when I first started using Labview. I got a little chuckle out of it and thought I'd post a link here for y'all.
http://physweb.bgu.ac.il/COURSES/SignalNoise/data_aquisition_fundamental.pdf
I did a quick google search but couldnt find Application note 001, anyone have a copy?
-
This code is full of unreadble text like that (another thing driving me insane) - its Japanese but not all of it translates with the language pack for some reason.
-
I'm sure I have lost my mind but I cannot figure out how to create an array of graphs. I inherited this project that was written maybe 10-15 years ago and i'm in the process of updating it to Labview 2013 but I cannot figure out how they created this array. Can anyone help? (Please see attachment)
Thanks.
-
Can someone please explain to me how this VI works?
https://decibel.ni.com/content/docs/DOC-11542
From the link "Note: It is important to set the Maximum and Minimum Values of your unknown frequency as accurately as possible so the best internal timebase can be chosen to minimize measurement error. The default values specify a range that can be measured by the counter using the 20MHzTimebase Use the Gen Dig Pulse Train-Continuous example to verify that you are measuring correctly on the DAQ device."
I'm trying to determine what the error will be in my measurement using this VI.
I am using a sensor to measure the RPM of a device that will rotate from 1,500-15,000 RPM. The sensor will provide a pulse every time a piece of reflective tape passes in front of it. I am currently placing 1 piece of tape on the device which gives me 1 pulse per revolution.
How can I calculate the measurement error using this VI if I set min Freq at 25 and max at 250? How is the "best internal timebase" chosen?
I am using an x series device for measurement USB-6343
Thanks.
-
Do you ever find yourself doing a whole bunch of extra programming just to avoid an "ugly solution" that was robust and really had nothing wrong with it, but it just bothered you so much you put in the extra work for something "cleaner"?
Am I even making any sense?
-
I usually end up using the OpenG one but was just wondering why they didnt have a native one
-
Why is there no variant constant on the variant palette?
-
Thats another cool tip!!! I get so set in my ways of doing things, I never pay attention to these things. I really got to get out more, what else am I missing???

-
retain wire values?
I had no idea! What version did that show up in?

-
Found it:
Thats kind of like going through some procedure to get to a break point, then realizing you forgot to probe a wire just upstream from the BP that you needed to see

XNET control does not fire change event
in LabVIEW General
Posted
Ok, I just updated XNET to 17.0.1 and this seems to be resolved. Thanks again!