

klrk
-
Posts
4 -
Joined
-
Last visited
Content Type
Profiles
Forums
Downloads
Gallery
Posts posted by klrk
-
-
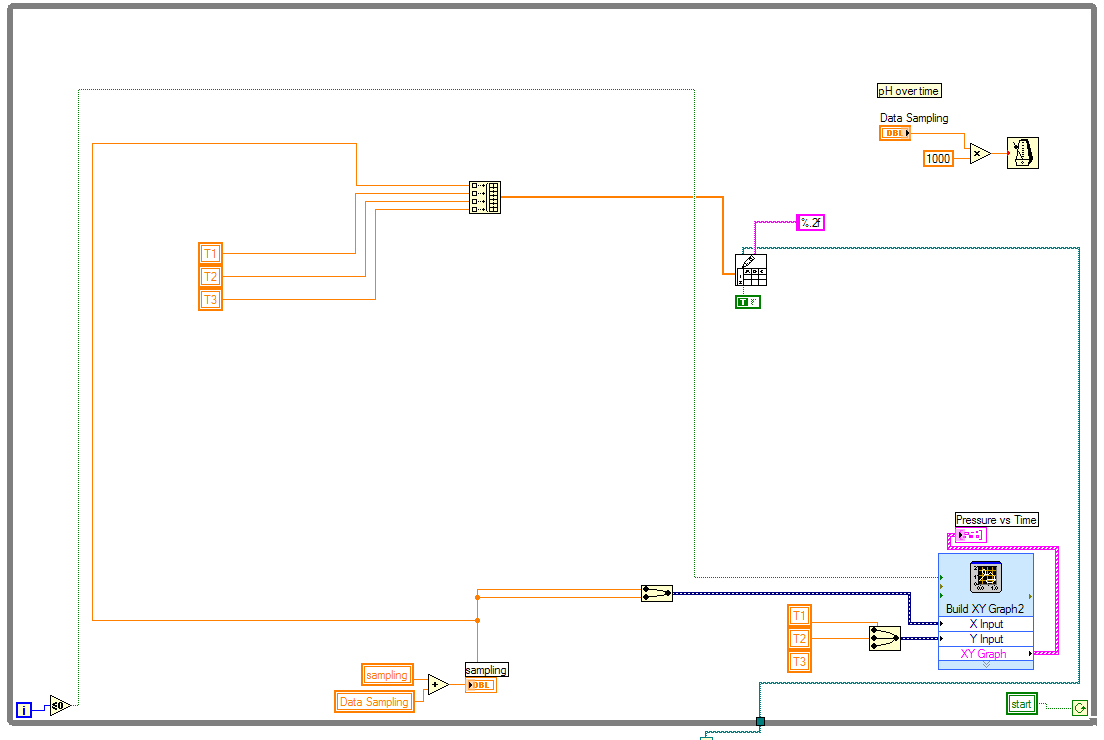
Good day

I have some questions on plotting a graph. It is indeed quite special for me since it caused me lot's of trouble and my solution had caused certain malfunction of the daq.
Here it goes, I was request to make a graph plotting which involved the below concept

The graph wll comprise of 2 plot lines each plotting, it will plot every 1 minute gap.
Meaning 2 lines every 1 minutes.
The x axis remain unchanged each plotting.
So,I want to know are there any way for it ? and preferably the graph will only take the latest 4 minutes of plotting.( but it's not so important)
Thank you in advance
-
Hi, this is my first time posting here. Sorry for I'm not very good in words.
I'm building a daq conmprising of getting data, write file, control and calculation for some reactor.
Since it'll be running for few days, I need to convert my running time from s to timeline
which is as attached below.
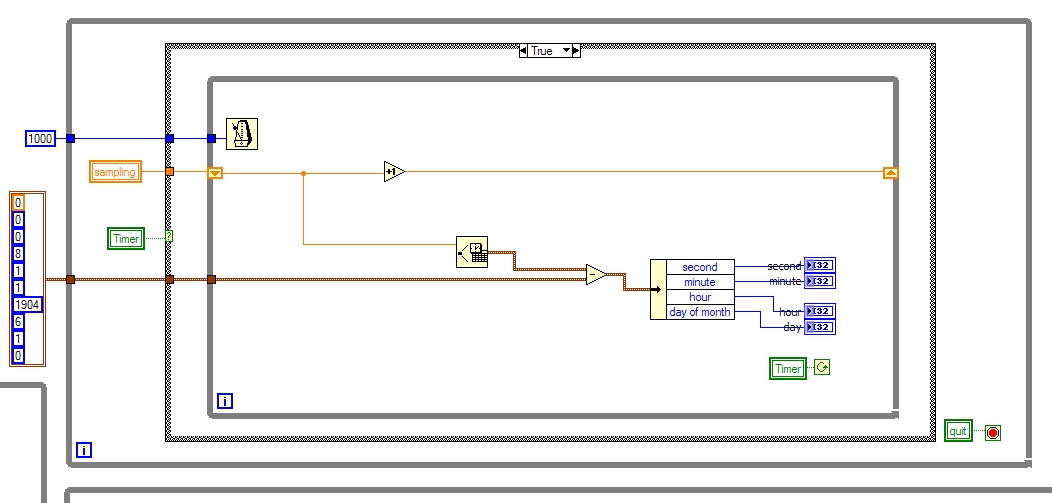
But the problem is that I made a data sampling time control in the main loop since it'll be running for days, there'll be whole lots of digits if it's in s.
As well as to make it more user friendly.
Below it's what inside the main loop

The data sampling control is to control how long it write once into xls file.
So, are there better alternative for this method ?
P.S: Since it'll be running for days, I want to know are there recommended ways for codes optimizing ? I'm still green at LabVIEW.
Thanks in advance.
-
QUOTE (miab2234 @ Dec 8 2008, 06:44 AM)
Hi Guys,I have a idea of making the Linearfit of my Graph but i cant get my values (X and Y ) from my programm out.The attached photo is that what i want to do, and my programm is also there.
waiting for reply
the one before graph should be build array, that's all

Syncing Time in different Loops
in LabVIEW General
Posted
Thanks for helping out, now I starting to have idea on how to implement it.