

GregPayne
-
Posts
10 -
Joined
-
Last visited
Content Type
Profiles
Forums
Downloads
Gallery
Posts posted by GregPayne
-
-
Thank you for saving it in LV2010.
Unfortunately I can't run it as I don't have NI_WebServices.lvlib. I am guessing it is not included in LabVIEW 2010 base.
Will give it a go at home later where I have LV2013.
-
Would you mind saving it for LV2010? That is all I have at work so can't open this vi.
Thanks,
-
My next step was to save the picturebox to an image. This was trickier than I expected. I kept getting a .net exception when trying to save the picturebox image.
After reading through a few forums and code examples, I found out that it is not particularly good practice to draw directly into a picturebox. The better way is to create a bitmap inside the picturebox and then draw onto the bitmap. Then all you need to do is call the bitmap.save() method and an image is saved.
I have attached my latest vi that saves the image drawn. I also added a timestamp and file path to the image before it is saved. The code is not very clean, so sorry. I'll be cleaning it up when adding it the the bigger application.
Cheers,
Greg
-
Thanks Neil,
Good point about creating the objects outside of the loop. I didn't even think about that... eek
-
For any one that is interested, here is how I got this working.
As hooovahh suggested, I used a .net picturebox and it is working well. Still need to add some tweaks, but the functionality is there.

I have also attached the vi if you interested.
Cheers,
Greg
-
Thanks,
I have just come across a similar article so might have to look at another way of doing this.
Will look into the .NET picture box and see how that goes.
-
Hi Everyone,
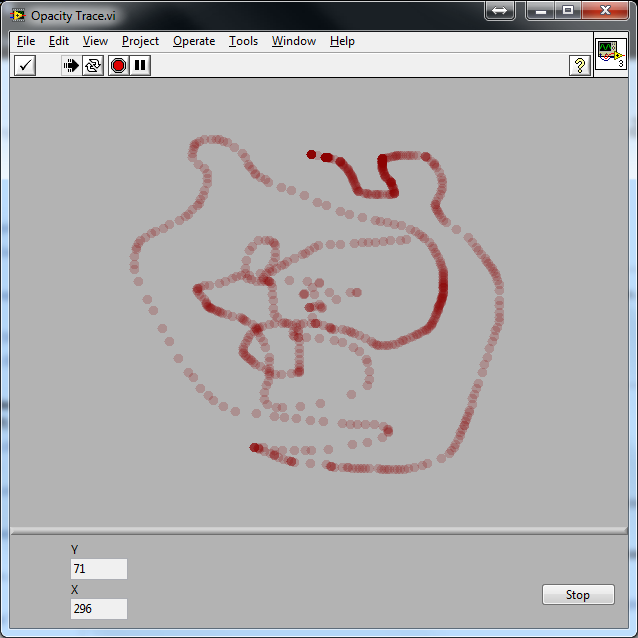
I am trying to create a picture in LabVIEW that records a trace. I want to get the concept working first before I add it to my program. I would like the end result to look something like this (I used Inkscape to create this image):

So the idea is a trace gets made with the opacity of the point set quite low (in the above case 0x48). Therefore when the same coordinate is passed over for a second time, the point gets darker. The darkness of the points will indicate which coordinate is passed over the most number of times.
At the moment I am using a 2D Picture indicator and drawing the mouse coordinates, but can't set the opacity, only RGB.
Is there another function that the opacity can be set?
Thanks,
Greg
-
Hi Andrew,
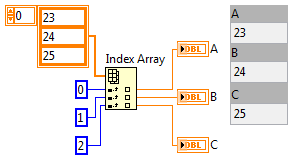
With reference to your first post, you can use the index array function to get the individual elements out of the array.
Are you able to control the format of the data from the serial port?
Could you provide the a sample of the exact data the is read from the serial port? That would help in working out how to split it into the three graphs.
Greg
-
Just been playing around with this, works with To Lower Case too.
Not quite sure where this would be used? According to LabVIEW help:
To Upper Case DetailsIf string is a numeric value or an array of numeric values, each number is evaluated as an ASCII value. The To Upper Case function translates all values in the range of 97 to 122 into values over the range of 65 to 90. It also translates any other value in the extended ASCII character set that has an uppercase counterpart, such as lowercase alphabetic characters with accents.
Any idea's where you could use this?
Greg
Create pictures with different opacity levels
in Machine Vision and Imaging
Posted
That would be nice. I think NI has started opening some of their vi's so they might get there eventually.