

seriousbeat
-
Posts
2 -
Joined
-
Last visited
Never
Content Type
Profiles
Forums
Downloads
Gallery
Posts posted by seriousbeat
-
-
Hi Guys!
I have a problem with my Offic toolkit. With my program i want to generate several graphs in a word document.
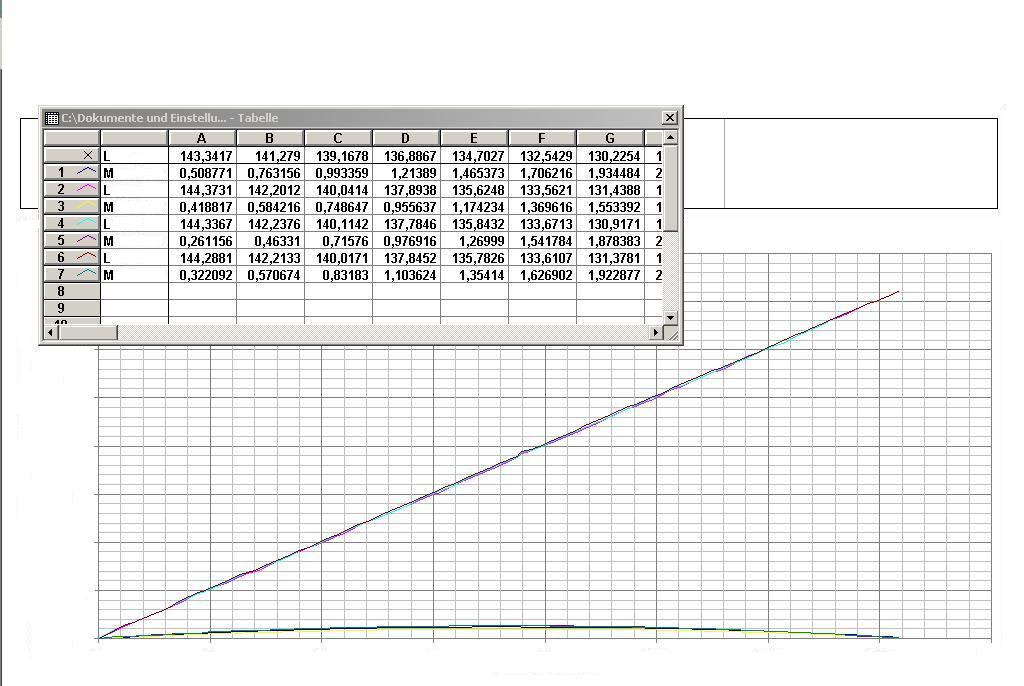
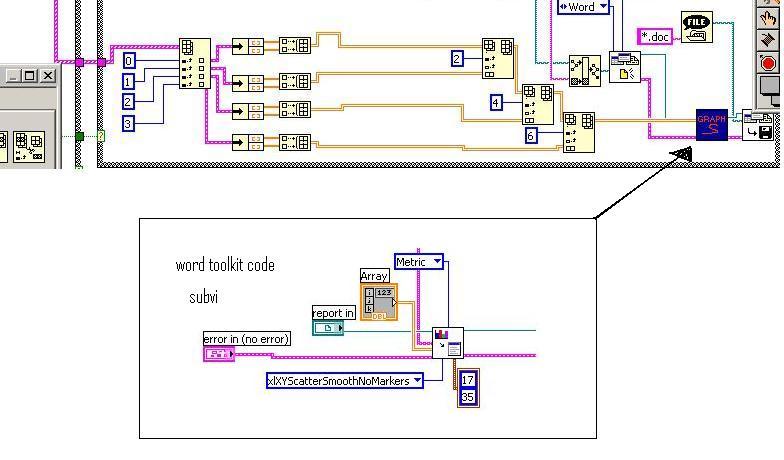
The problem is, the toolkit VI interprets the 2D array as 1 row of Xdata and 7 rows of Y.data and plots this correctly as shown in picture 2.
 But i want to have four several xy-graphs in word! The Vi should show the others graphs like the graph in picture 1!
 What should i change in my toolkit code, that my program works???
Thank*s in advance!
S.


PCI-6220 analog input configuration
in Hardware
Posted
Why don*t you try the daqmx VI's???
There are many examples for DAQMX!
best regards,
s