

zero-tolerance
-
Posts
54 -
Joined
-
Last visited
Never
Content Type
Profiles
Forums
Downloads
Gallery
Posts posted by zero-tolerance
-
-
Hi there. This should be a simple solution but I don't seem to get it working.
Attached is just an example that based on the users choice, the graph can have two or one plot. But what I need it to do is whenever the second plot kicks in, I need it to be at specific colour, e.g. only green. Changing the line width of the second plot works fine, but the colour doesn't seem to respond, its always plotted as black, not matter what value I choose for it. The first plot is always red, thats fine because I made the changes on the properties of the graph, but I can't choose the colour for the second plot.
Any help is appreciated
Thanks
Kas
-
QUOTE(Michael_Aivaliotis @ Oct 10 2007, 10:07 PM)
Try using the "sort array" function in the array palette.I allready did that but the sort array function only works by looking at the first "character" where in my case would be a number i.e. 123 "CD Name". So it sorts it out based on the numbers that are at the beginning of each element of the array. But in my case I want to sort them based on the "CD Name" but when sorted I still want to keep the ascociated number that goes with it.
I have somehow managed to do this but I'm not too happy with the way I have done it. I'm thinking that there must be a much better way of achieving the same results.
The attached program is an example of what I'm woring on and its on two versions of LabView (8.5 and 8.2). Please ask if you need for version 8.0.
Any help appriciated.
Thanks
-
Hi I'm trying to make a program that can sort out this text file alphabetically. The example is as follows:<BR><BR>I have a list of all my CD where they are each placed on my CD case holder. For easy finding each CD slot on the case has a number from 0 to 500. So I have made a lit of all my CD's using excell. So when I'm looking for a CD I look for the name on my list (which is sorted alphabetically) and then just check the number next to it.
My list looks something like this:
126 <Tab> Big Bear
125 <Tab> Panorama
173 <Tab> Small Bear etc....
The Above Example is alphabetically in order depending on the CD name and not on the number next to it.
I have allready made a program that automatically searches the list based on CD name and adds the new CD with the number next to it on the text file, but when I add the new Name it is not appearing alphabetically, i.e. I can put the list on the ascending order based on the number but not based on the CD name.
Any help appriciated
Thanks
-
Hi I'm trying to make a program that can sort out this text file alphabetically. The example is as follows:
I have a list of all my CD where they are each placed on my CD case holder. For easy finding each CD slot on the case has a number from 0 to 500. So I have made a lit of all my CD's using excell. So when I'm looking for a CD I look for the name on my list (which is sorted alphabetically) and then just check the number next to it.
My list looks something like this:
125
-
QUOTE(Tomi Maila @ Mar 4 2007, 12:15 PM)
Ton's answer was proper and that's all there is to your question about why the FFTs of the signals are the same except for the DC component. Your reply above doesn't make any sense. Please tell us what are you trying to do, not just the FFT part of it but the whole story. You may be doing or thinking something the wrong way and it's not the LabVIEW FFT that's the problem here.Tomi
I see, sorry for my previous post. Now, what I am trying to do
 :
:I get a list of readings from a Lock-in-Amplifier and I plot the graph. the amount of points that I normally read are around 4000. But for the sake of simplicity here I'm only using around 320 readings (i.e. points).
1) When this 320 points are plotted, the graph looks like the 2 graphs on the left (see uploaded picture). But, the problem is that everytime you try to repeat the experiment the Maximum and the Minimum points on the graph never appear at the same spot. i.e. if the same experiment is carried out again, the Min. and Max. will definetly be shifted by 10 or 15 points to the right or the left.
Now, to come around that problem I wrote the LabView code so that it counts the amount of points from the CENTRE (I mean the centre between the Min. and Max.) to the right of the graph and the left. Now, whichever side of the graph has more points means that the Min. and Max. position is shifted on the opposite side. The next step my software does is cut the amount of readings that are needed from the side that had more points so that the CENTRE point (between Min. & Max.) lies in the middle of the graph.
2) In the very end when the above point is completed, the segment size (i.e. the size of the graph) is reduced to the nearest smaller number that has a factor of 5, and factors of 2 or 3. This is the number of points used in a Discrete Fourier Transform (DFT) to obtain the spectrum. From the spectra of measurements with and without a sample, refractive index and absorption coefficient can be found (this is done on the "Data Calculations.vi").
3) The final changes that I do to the graph before applying the DFT calculations (i.e. the FFT in the PC) I take the mean of the graph. Since the majority of readings that are taken from the Lock-in-Amplifier can sometimes be greater than zero or less then zero, and in that case I try normalise this issue by taking the mean of the whole graph (i.e. adding all the elements together), and dividing the result with the number of points (i.e. No. of elements), where in this case its 321, and finally subtracting this results from each element of the array that was used at the beginning. Maybe I don't need to apply the "3)" point at all, but this is as far as I have gone.
But, when I apply point "3)" its as if its not there, and the reason for this (as explained on the previous posts) seems to be this DC components that are the same.
All the three points are done under the "ZPD Balance.vi" VI. This VI uses another subVI called "Frequency calculation.vi".
The main reason that I am actually implementing point "2)" is so that I can find the fundamental frequency of the graph. If anyone has an idea of how to find the fundemental frequency from MY data than please share the idea with me.
Sorry for making it long but I just wanted to explain my issue as clear as possible.
The program "Calculations testing.zip" uploaded by me on the prevous post does all of this. All you have to do to run the program is:
1) double click on the "Main" VI, then just specify the path or the 2 TXT files. Make sure that the right file is chosen, and finally press RUN.
-
QUOTE(tcplomp @ Mar 4 2007, 11:04 AM)
Well your datasets just have a DC offset:http://forums.lavag.org/index.php?act=attach&type=post&id=5113''>http://forums.lavag.org/index.php?act=attach&type=post&id=5113'>http://forums.lavag.org/index.php?act=attach&type=post&id=5113
The green line is a substraction of the two data sets, as you can see the difference is minimal but constant. The first element of a FFT indicates the the DC component of the signal so the difference only exists in the first element.
Ton
So I'm guessing this is it, I mean I can't resolve the issue? Because I know the change is very very small but nontheless this very small change is probably costing me the accuracy of the main results at the end.
And if you have seen the shape of the signal, then all I'm trying to do is make sure that the signal lies around the "0" position of the "Y" axis. So, all I do is find the mean of the signal, and subtract that mean from every single element of the original signal (i.e. array).
-
I have two similar DBL arrays that I am feeding to the FFT function. The answer however is exactly the same. even though both of the input arrays are similar the answer shouldn't be the same. Actually the only thing that changes after the FFT is carried out is the first element of the array, and the rest of the elements are all the same.
An example of what I mean by this is given below, as well as part of my program that I have implemented.
Any suggestions to why does FFT give out the same answer to both cases?
Anything is appriciated
Thanks
-
I managed to do the program, but I'm not sure if there is a better way of doing it.
I have attached the program that does exacly what I need it to do.
Any advise is appriciated.
Thank you all again for the help.
-
QUOTE(Mikkel @ Mar 1 2007, 07:13 AM)
A Very quick and easy solution. Thank you, I never thought of doing it that way.
QUOTE(Mikkel @ Mar 1 2007, 07:13 AM)
2) Uhh. Lost me there
haha, sorry for bad explanation. The list of numbers shown on the previous post is only a list that decide what should the size of an incomming array be. For example, If I have an array that is of size 80 or 81, as soon as it goes through the list of numbers, the size of This array will be droped down to 60. Because the next smallest number on the list other than 80 is 60, so the size of the array that was at the beginning 80or 81 is droped down to 60. This means that 20 of it elements are deleted.
I hope this is a better explanation.
Thank you
-
Sorry guys but I need some more help.
Last night I was trying to do 2 things that I couldn't accomplish AGAIN:
1) From all the numbers that are generated (as above) there are some duplicates. i.e. the integer "0" is repeated a few times etc. And I am trying to remove them since I only need 1 copy of every digit. The problem I am facing here is that the duplicate elements are not next to each other inside the array, for example number appears on index 1 of the array and then the same number on index 30 again etc.
2) Final problem is the averaging. Out of all the numbers I have on the array (i.e. the big list of numbers generated) if I input an array with size 4000, it will go through the list of numbers and the size of the same array on the output should be 3920 on the output. So the last 80 elements of the array are discarded. So, what I am basically trying to do is resize the input array based on the array sizes that are available on the table (i.e. the big list of numbers generated). So the input array was 4000 and the same size is also available on the table, but the next size smaller that 4000 that is available on the table is 3920, so thats the size the input array should choose to take on the output.
The above I couln't accomplish all night yesterday, so again any help is appriciated.
Thank you in advanced.
-
Thats amazing, thank you both, it actualy works.
Thanks again.
-
Hi everyone. I just have a part of a program that that is written in Python that I don't understnd whats happening. I need to built a LabView code that does just that. I have completed most of the program but this part of it I don't quite understand. I have uploaded this in TXT format so everyone can have a look. The code is not long and probably is not hard to see whats happening but for the moment I haven't got a clue what did the previous person try to do with this part of his python code.
My understanding is that he is multiplying 5 with the values [1,2,4,8,16,32,3,6,9,12,24]. Then 2 multiplyed by [1,2,4,8,16,32,3,6,9,12,24] then 3 by [1,2,4,8,16,32,3,6,9,12,24] and finnaly removing any duplicate values that come out.
If so, then what is the commented part in BOLD telling:
K1 = [i*5 for i in range(20)] # 5, 10 ... 95
K = []
M = [1,2,4,8,16,32,3,6,9,12,24]
for j in range(len(M)):
for i in range(20):
K.append(K1*M[j]*i)
Any help is appriciated.
Thanks in advanced.
-
There are functions in the String palette to convert an array to a string and vice-versa, so that should take care of the array part.
To find the actual array when you read from the file you need to find the last semicolon and read what's after it. You can do this by searching the string in a loop (or reversing it and searching for the first occurence) or perhaps by converting the entire file to an array with a semicolon as the delimiter.
Thanks for the reply, but I'm actually using something known as "State Memory" to create the Arrays and finally I'm creating a 2D array from all of the results that I have and Saving it on users choice. I'm posting the example just incase someone else needs it.
Thanks again for your reply
-
Hi everyone, I am trying to save the data that I have in an array into the file format as shown below. The input array only contains numbers on it but it is on a string format. The words and the writting that is shown in the attachment must be added to the file automatically.
Is there a way of doing so. The problem is not just writting into a file but also being able to load the data i.e. the numbers that are saved into the file and input that into a string array just as it was at the beggining before the array was saved into the file.
Would anyone ahve an idea of how to do around this problem at all.
the atached file can be opened using Notepad
thanks in advanced
-
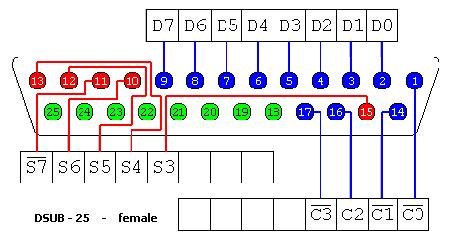
Hi again. I just tried making a simple example for talking to the parallel port pins but so far unssuccesfull.
Below is an attachment of just a simple example that I wanted to see wheather I could drive at least one of the pins High or Low.
On the attachment VI all I'm doing is sending a 85 decimal number to the input port, which means that I am senidng 10101010 to the port.
I am checking the pins using a Voltmenter. If its LOW then I should get below 2.5 V and if its HIGH then I should get anything above 2.7 (I think).
When I check the D0 to D7 Pins i.e. pins 2 to 9, I get all high (they are roughly 4.57 V).
My understanding so far is: 10101010 has 8 bits, meaning that I am sending HIGH to pin 2, LOW to pin 3, HIGH to pin 4, LOW to pin 5 etc..
is this correct??
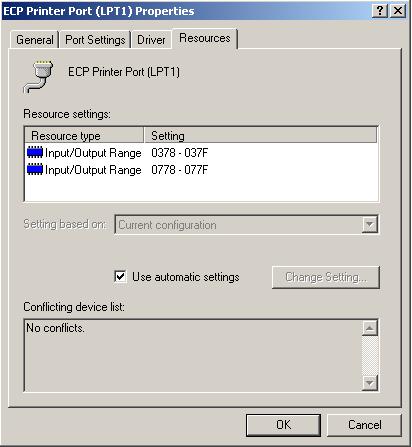
The Parallel ports address is 378 (hex). Just to make sure I have attached the parallel ports addresses the way I see it on the system, since I'have 2 types of addresses showing on the screen.
Any help would be appriciated. Thank you again to everyone who helped me so far.
Download File:post-4068-1162825836.vi
-
Hi zero............
here one more example - how to talk to chip via SPI ( eg. g. 16Bit)
Hope this helps to understand the sequential Operation with LPT - Port
Regards
Werner
Many thanks for your reply "wha" and "Falevoz Y.", I am still on the process of understanding the program "wha" gave me. It looks probably just what I need (even though mine is much simpler than that, since all I need is 2 output ports to talk to my motor controler board and 1 input from the "hall effect" i.e. I will only recieve a HIGH (5 V) when triggered and the rest of the time it will be LOW (0 V) and also I'm not too much worried about the timing issues).
I haven't been involved in this type of work before and even though I have done some work on LabVIew ( for about 2 months ) I am still at the beginners level. Thanks again.
-
You can write to the parallel port using Out Port. Please see the examples at the locations listed below. The address of the parallel port is x378.
Parallel Port Read and Write Loop VI: labview\examples\portaccess\parallel port examples.llb
Parallel Port Additional Data Register Inputs VI: labview\examples\portaccess\parallel port examples.llb
accessing parallel port I don't have a problem with, but what I need is to use 3 parallel port pins as I/O pins, i.e. I need to send a pack of 0's and 1's to one particular pin only (lets saypin 2) because I don't want to use the hanshaking signals etc on the paralel port. Also I need to recieve a signal HIGH from the Hall affect where in computer language that would be 1. Would anyone happen to have an example??
Thanks in advanced
-
Hi everyone. I'm involved in a project where I'm controlling a stepping motor via a Unipolar Stepper Motor Board (manual provided on the link. I only want to controll the direction and the speed of the motor and I'm using a Hall affect detector for the zero position of the motor. (i.e. i'm basically using it as a referanc position)
http://documents.rs-components.com/rs-bin/...900766b802ee6cd
Anyway, my main concern for now is to talk to the Motor controller Board through the parallel port of my PC. I am using Windows 200 Platform (I don't think it would make a differene).
I have previously used LabView when I was involved in a different project but then I used srial port as the link with the hardware I had.
What I really need is to directly controll 3 pins of the parallel port: 1 for direction, 1 for speed and 1 for zero position. Two of the pins will be connected to the motor Board and the third one to the Hall Affect detector.
So, does anyone know how to directly access th parallel port pins through LabView.
Thank you
-
A Scmidt Trigger IC (74C914N) is an easy way to filter out the unwanted counts caused by spurious voltages out of range. A breadboard and some wires should be all necesary to wire the chip up.
You can also make it even easier by just using a low pass filter i.e connecting a capacitor across the result or the output, but don't choose a too high value of the capacitor because you will filter the good signals too.
-
If you want to have smooth rotation, a pict ring would be cumbersome, (too many pictures).
This sounds like a perfect application for using the Picture Control.
The turntable picture consists of just a number of circles, filled with different colours.
I would set it up this way:
Set up a cluster array. Each cluster specifies a circle centre, radius and fill colour.
A simple rotation transform on the array would put all the circles where you want them w.r.t. the centre of the picture control.
Once the coordinates are transformed, a loop passes the coordinates to the Draw Circle primitive (in the Picture Control Palette).
If you want to get fancy and use shading, refer to the Robot.vi in the examples directory. There are some good subroutines there. (Shading is just radius+1 then draw an arc of 180 deg.)
Good Luck,
Barrie
Hi Barrie, that sounds like a good idea, and you seem to be using LabView version 8.0, but is it possible to just make a screenshot of the wiring on how you would set this up, (i'm really sorry but I only started using labview resently).
ou and I couldn't find this Robot.vi example, and where is this Example section in this forum cos I couldn;t find it, I can't see the link anywhere.
Thanks a bunch
-
You can put the images in a picture ring:
Sorry but I have LabView version 7.1. and I can't open the example, possible you can convert it on 7.1 version???
Thnx
-
Could you take 6 digital photos of the holder, one for each of the positions. Then based on the setting of your sample selection control, dipslay the appropriate picture in one of LabView's native picture controls?
Now that I never thought of, but I wouldn't really know how to do that neither
 (sorry not very experienced in LabView), is it possible if you could send me a sample program? Thnx
But I would still preffer it the way I explained on the first posting, and I know that it might take some time to build it but I would be most greatfull to those who have some spare time to spend on this.
Thanks again
-
Hello everyone.
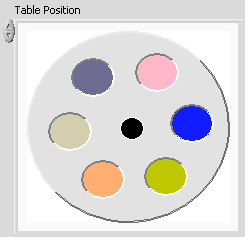
I have a rotating holder that holds 6 different material samples. This rotating holder is mounted in the centre onto a small motor that rotates the sample holder. The project that I'm involved in is quite big and is to do with Dispersive Fourier Transform Spetroscopy (DFTS), and by this I measure the dielectric properties of different materials. Anyway, most of it is going fine but I'm using now LabView to controll the device, and at the moment I am stuck on this part where I have the sample Holder holding 6 different material samples. At the moment I have it physically built and connected to the actual machine and I've tried it through Hyper Terminal and the motor works, but I also want to actually illustrate this via custom made graphics (so it looks good). So everytime I press a button then this sample holder should be rotating in labview, and the way it should rotate is as follows.
Lets say I have a Numeric Controll and I type the number "1" in it, and I press the Bolean button "Send" then at that point the sample holder should rotate for only one circle (showing that the next material sample is loaded), and if I send a numeric number "2" and I press the "Send" button then the sample Holder should rotate for excacly 2 circles (showing that not the next material sample but the one after it is loaded).... and so on. There might need to be a referance point and it should be on the top of the sample holder (which would be the place where the Laser will go through the material and the measurments are then taken).
I have only attached a very very simple drawing of what I was going to use, and I have painted different circles with different colours indicating that there are different material samples on each hole.
I thought of making a realy good drawing on Paintshop by making it look like a proper holder, and perhaps draw a small motor on the centre to make it look really nice, but I have no idea if LabView would accept it if I just copy and paste the picture and I have no idea how to make it rotate. If any of you can help me out on this I would be most appriciated. Thankyou
Ou, and if anyone wants to make a new drawing (using the same idea to the one I've given you) then please do so, since LabView doesn't have much of drawing options.
Thanks again in advanced.


Graph Colours
in Development Environment (IDE)
Posted
QUOTE (PaulG. @ May 20 2009, 01:03 PM)
That did the job. Thanks