

yaba
-
Posts
18 -
Joined
-
Last visited
Never
Content Type
Profiles
Forums
Downloads
Gallery
Posts posted by yaba
-
-
ouh, sorry, the "my website" link is in my signature, it is there with every post, and was not intended as a specific link to a solution for your problems.
Ok, I don't know much abour your programm, but as far as you described it, it sounds to me, as if it would be the best way, to merge your two programms into one. I would programm the control of the turntable and the data-aquisition in one while loop, and all syncing problems are dust in the wind. Since you have developed the two parts (control of the turntable and the data aquisiton), it should be no problem, to merge them.
Or - to cut a long story short: I would do this:

Or did I miss the track completely?
Thanks u for your time spend on my problem. But may be there some misunderstanding about what I try to explain. I have got the 2 programs: 1is used to read the spectrum analyser and the 2e is to turn the turntable. Both are use GPIB. Now if I put them in the while loop. How am I got to link the stop function so both can stop at the same time? I hope my explaination will help u solve my problem. Thanks in advance.
-
-
Hi
I am struggling on the last part of my project, which, consist to run two programs together (see attachment). The first program is implement to run a turntable (antenna receiver) to read the angle.
The second program is used to read the max amplitude of that particular angle.
NB: The transmitter is facing the turntable at 180degree. So we taking an antenna reading (angle and amplitude) according to transmitter
For example I want to take a reading from 110 to 170degree.
Because the receiver is facing the transmitter at 180 therefore 180degree on my representation is 0degree (180-180=0) where the first amplitude reading will be taken and the max value 0f 180 (0) will be save for a little while so that I can take the second amplitude reading at the starting point (110) which is = 110-180 =-70degree on my representation. From this point I can take a reading at each 1000ms and also save their max value while saving also their angle (let say a 0degree=? dB, (110-180) degree= -70degree=? (120-180) = -60=? And so on). The max amplitude value of 0 (180) will be subtracted from these amplitude values obtained so the result will be used to plotted against angle in XY graph where X=angle and Y = amplitude. (Where the high point will be 0(180) degree= 0dB on the graph and so on.
I am very sorry I fogot to mention that I am taking the amplitude reading from my spectrum analyser that means that when I am reading the angle value from my first program (turntable implementation) the spectrum analyser implementation also read the amplitude value. And there is one more I would like to ask, if anyone can give me an example how the 2 programs can be run in synchronizing.( means they run a this period of time and stop a this same period of time because I realise that my two program are not synchronized when I stop one the other is still runnig. I will be very happy if I have got a reply for my post because I am stacked on this particular and this is used for
 my final year project and also Iam running of time. Thanks u in advance for all your helps. Thanks.
 -
Hi
I am struggling on the last part of my project, which, consist to run two programs together (see attachment). The first program is implement to run a turntable (antenna receiver) to read the angle.
The second program is used to read the max amplitude of that particular angle.
NB: The transmitter is facing the turntable at 180degree. So we taking an antenna reading (angle and amplitude) according to transmitter
For example I want to take a reading from 110 to 170degree.
Because the receiver is facing the transmitter at 180 therefore 180degree on my representation is 0degree (180-180=0) where the first amplitude reading will be taken and the max value 0f 180 (0) will be save for a little while so that I can take the second amplitude reading at the starting point (110) which is = 110-180 =-70degree on my representation. From this point I can take a reading at each 1000ms and also save their max value while saving also their angle (let say a 0degree=? dB, (110-180) degree= -70degree=? (120-180) = -60=? And so on). The max amplitude value of 0 (180) will be subtracted from these amplitude values obtained so the result will be used to plotted against angle in XY graph where X=angle and Y = amplitude. (Where the high point will be 0(180) degree= 0dB on the graph and so on.
-
hi all
I made a program that can read RF amplitude and freq from the spectrum analyser. Now I want take several amplitude mesurements with the same freq value and put the high value in the table so I can print it later.
NB: I have to set different freq value and take their max amplitude values and put these value in the table as spreadsheet so I can print them later. These max value must be display on the front panel. let say for freq=4GHz, 1e mesurement = -22dB, 2e = -34dB, 3e = -12dB this mesurement must be put in array so it can sent the max value (-12dB) in the spreadsheet. Set another freq value take amp value and put the max value in the same table. At the end I can print all these max value.
I need help to build these array because I am new in labview and this for my project.
Thanhs
Hi
I am struggling on the last part of my project, which, consist to run two programs together (see attachment). The first program is implement to run a turntable (antenna receiver) to read the angle.
The second program is used to read the max amplitude of that particular angle.
NB: The transmitter is facing the turntable at 180degree. So we taking an antenna reading (angle and amplitude) according to transmitter
For example I want to take a reading from 110 to 170degree.
Because the receiver is facing the transmitter at 180 therefore 180degree on my representation is 0degree (180-180=0) where the first amplitude reading will be taken and the max value 0f 180 (0) will be save for a little while so that I can take the second amplitude reading at the starting point (110) which is = 110-180 =-70degree on my representation. From this point I can take a reading at each 1000ms and also save their max value while saving also their angle (let say a 0degree=? dB, (110-180) degree= -70degree=? (120-180) = -60=? And so on). The max amplitude value of 0 (180) will be subtracted from these amplitude values obtained so the result will be used to plotted against angle in XY graph where X=angle and Y = amplitude. (Where the high point will be 0(180) degree= 0dB on the graph and so on.
-
Hi van18
The program is working with the for loop u sent. thanks
Now I want to use the measurement data to plot into the xy gaph ( if possible wave form graph) where x is the angle obtained ( let say the starting point is 90 and finishing p. is 270 ) from my receiver and y is the amplitude measurement obtained from spectrum analyser . Both instrument are connected in parallel through the S.Analyser.
I want to obtain the graph in this way:
180deg(on the graph) =0dB
I am having problem writing it
This is my starting point
Thanks
-
I have no idea why you are getting a labview exe error. I have attaced a vi that illustrates how to buil the array and use a shift regester to keep a running max value. This is basiclly what I added to your code. I am simulating the equipment output array with for loops. Another point, you have defined your array as 3 deminsional in the spreadsheet to string array, I have not seen very many device that output the data in a manner that would require 3 dimension. Also are you sure your format string is correct? None of these things should cause an exe error.
Hi van18
The program is working with the for loop u sent. thanks
-
I have no idea why you are getting a labview exe error. I have attaced a vi that illustrates how to buil the array and use a shift regester to keep a running max value. This is basiclly what I added to your code. I am simulating the equipment output array with for loops. Another point, you have defined your array as 3 deminsional in the spreadsheet to string array, I have not seen very many device that output the data in a manner that would require 3 dimension. Also are you sure your format string is correct? None of these things should cause an exe error.
I am reading the higher value now after stopping the application. Now I want to keep this higher value in the table for while and take others readings (these reading must also display their max values in the same table where is the first higher value) without changing the setting and now find the max values of these higher values. next step is to change the setting (RF input, stop and start freq ) and do the same things let say take readings. At the end of work I will get different freq and their max amplitude in the table so I can print them. thanks
-
I will be at uni next week, I will test it and let u know. thanks for your helps so far

hi sir
When I run the program it gives me PROGRAM ERROR (LABVIEW.exe has generated error and will be closed by windows. You will need to restart the program. An error log is being created>and the window log off.
-
I modified the VI for you, this I belive is what you are asking for. Again I strongly suggest you read up on while loops, for that matter Labview basic fundementals. Also, the analyzer will do this for you, Max peak hold continuous sweep or somthing similar, read the operators manual
 Hope this helps :thumbup:
I will be at uni next week, I will test it and let u know. thanks for your helps so far
-
I am still confused as to what you are trying to do, and you did not include any of the sub VI's. The simple answer to your question is you need to read up on while loops , the only value you will get in the Max Value indicator is the last value output from the instrument read VI before stoping the application. I have no idea what the three array controls are for, and if you are reading the whole array from the analyzer to display on the graph, why use the markers to get the max value, just get the Y values from the read spectrum VI and get the max. Also, the shift regesters in your while loop serves no purpose
 . You refer to setting diferent freqs and measuring amplitudes, I don't get it, unless you are seting the center freq with O span, you have a range of frequencies based on the start, stop and number of data points. Here is my advice based on a lot of assumptions and very little information. Manually set up the analyzer for the frequency range of intrest, put it in MAX peak hold and continuous sweep, measure what ever it is you are measuring. Once you no longer see the plot on the analyzer changing, assume you have captured the highest amplitude at each frequncy, and stop the measurement. Run the spectrum VI, from its output, with a little code, you should beable to write it to a spreadsheet and save as a file. Just keep runing the VI with whatever frequncy range you are intrested in.
I am reading an instruemnt and I am getting a value that I want, but I would like to read the instrument again with the same setting and get another value so that I can compare the two values and find the higher value because the value is always changing a little. Is it possible to save the first value for a little while so that I can get another value and compare them and the higher value will be sent automaticly in the table to be print. I used the array to do that but I am not sure if it right. I did not test it because I am away from uni for a week and I do not have the equipments to do it.
NB: the subVI's did not not included because these are spectrum analyser drivers downloader from ni.com. I do not know how to sent them to u.
I enclose the modify program with the array for u to see. so I can get help thanks
-
What is the manufacture and model number of your spectrum analyzer? Give some more details of the task you are trying to accomplish. Typicaly you would set the analyzer up with a start and stop freq, sweep time and other important settings in the spectrum analyzer. once you have the analyzer setup, start your sweep in continuous mode with MAX peak hold. Once you are satisfied you have captured the maximums at each freq, you can retrieve the entire array from the analyer. There are Labview drivers for most of the Agilent/HP Spectrum analyzers at NI website.
The manufacture and model number of the spectrum is ROHDE&SCHWARZ FSP R&S 9kHZ~40GHz. As I explained above the program is working I can read the max amplitude or max freq value but what I want, is to put the read max value so I can it in spreadsheet and print them (see above the first post for more explaination) see also the figure
-
hi all
I made a program that can read RF amplitude and freq from the spectrum analyser. Now I want take several amplitude mesurements with the same freq value and put the high value in the table so I can print it later.
NB: I have to set different freq value and take their max amplitude values and put these value in the table as spreadsheet so I can print them later. These max value must be display on the front panel. let say for freq=4GHz, 1e mesurement = -22dB, 2e = -34dB, 3e = -12dB this mesurement must be put in array so it can sent the max value (-12dB) in the spreadsheet. Set another freq value take amp value and put the max value in the same table. At the end I can print all these max value.
I need help to build these array because I am new in labview and this for my project.
Thanhs
-
No this is the first time I am using the labview> I have already downloaded the R&S driver (ROHDE&SCHWARZ FSP R&S 9kHZ~40GHz) into my labview lib. It is GPIB. I have already started the program which I have attached for u to see. The first program allows me to found the peak value through the marker and also display the graph. I try to modify the program so I can get the max peak value at any time when the frequency shift using RSFSPpeak get value (because at a higher value the frequency is not constant it varies). Let say if i want to take 3 measurements at 8Ghz I will get 3 different max amplitude values and the higher amplitude will be sent into the array. But it does not work and I need help.
NB: Do I need to use a single sweep each time when I take a measurement?
I am still having the problem doing my project if anyone is able to help me with the problem mention above. I will attach the spectrum analyser driver so you can use for the program.
Thanks
-
No this is the first time I am using the labview> I have already downloaded the R&S driver (ROHDE&SCHWARZ FSP R&S 9kHZ~40GHz) into my labview lib. It is GPIB. I have already started the program which I have attached for u to see. The first program allows me to found the peak value through the marker and also display the graph. I try to modify the program so I can get the max peak value at any time when the frequency shift using RSFSPpeak get value (because at a higher value the frequency is not constant it varies). Let say if i want to take 3 measurements at 8Ghz I will get 3 different max amplitude values and the higher amplitude will be sent into the array. But it does not work and I need help.
NB: Do I need to use a single sweep each time when I take a measurement?
I've come back for more.
Group: Member
Posts: 2
Joined: 21-February 06
Member No.: 4215
Years using LV:< 1
Version:LabVIEW 7.1
No this is the first time I am using the labview> I have already downloaded the R&S driver (ROHDE&SCHWARZ FSP R&S 9kHZ~40GHz) into my labview lib. It is GPIB. I have already started the program which I have attached for u to see (SEE ABOVE). The first program allows me to found the peak value through the marker and also display the graph. I try to modify the program so I can get the max peak value at any time when the frequency shift using RSFSPpeak get value (because at a higher value the frequency is not constant it varies). Let say if i want to take 3 measurements at 8Ghz I will get 3 different max amplitude values and the higher amplitude will be sent into the array. But it does not work and I need help.
NB: Do I need to use a single sweep each time when I take a measurement?
-
No this is the first time I am using the labview> I have already downloaded the R&S driver (ROHDE&SCHWARZ FSP R&S 9kHZ~40GHz) into my labview lib. It is GPIB. I have already started the program which I have attached for u to see. The first program allows me to found the peak value through the marker and also display the graph. I try to modify the program so I can get the max peak value at any time when the frequency shift using RSFSPpeak get value (because at a higher value the frequency is not constant it varies). Let say if i want to take 3 measurements at 8Ghz I will get 3 different max amplitude values and the higher amplitude will be sent into the array. But it does not work and I need help.
NB: Do I need to use a single sweep each time when I take a measurement?
Are you serious?!? Just what part of your project do you need help with? Have you ever used LabVIEW before? Do you need to learn how to program? Do you just need assistance on connecting the R&S spectrum analyser? Have you contacted R&S to see if LabVIEW drivers exist for the model that you've got? Is it an ethernet interface, GPIB, RS232? Either you have to give us more information or you need to seriously consider hiring a System Integrator to help you out... -
Hi
The first part of my project consist of using labview to connect to the spectrum analyser (R&SFSF) and take a reading from that spectrum.
NB: display the value of frequency or bandwidht from spectrum into the labview for example using a marker. I am new in labview soi need some helps.
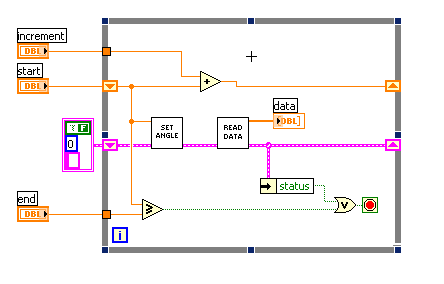
How To combine my 2 programs to make it on program
in Application Design & Architecture
Posted
The case is the 2 instruments are connected in parallel through my computer. As I said I want to measure Amplittude and the angle of an antenna. the turn table is taking the angle measurement while the Spectrum analyser is reading the Amplitude. Therefore the 2 programs must run at the same time and stop at this same time. If u have some examples to post to me that will help me. (example of 2 synchronizing device or program using GPIB). Unfortunitly I don't have LV.8 . My version is LV7.1
  . Once again thanks for your reply.