

skywalkerxp
-
Posts
21 -
Joined
-
Last visited
Content Type
Profiles
Forums
Downloads
Gallery
Posts posted by skywalkerxp
-
-
How to create the "block Diagram" refnum? i have no idea about it.

thanks.
Hi,Folk.
I think the reason is you don't open the LabVIEW Script function.
add this into your LabVIEW.ini file which is under the LabVIEW directory
SuperPrivateScriptingFeatureVisible=True
-
Little girl's age is the same with LabVIEW 8.0
Congratulations!!!
-
I like to use Blue BG with Grey White FG, That's look very common in lab.
-
Hi,Jim
The CIT's product need money to pay.
Is there articles or document to describe the detail?
-
Someone has an idea to burn CD in labVIEW?
Please give me some hint.thx.
-
I am looking for the method to solve that problem:)
-
this may help
Cheers Qia

-
Gentlemen,
I am wandering it can be or not? :question: If not there is an alter way? :thumbup:
Thx

Qia
-
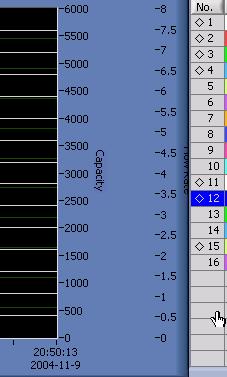
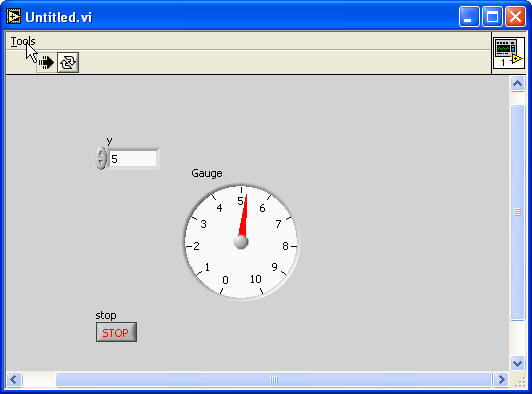
I got another problem.
please look at the pic I attached
When I use the hide/show property of graph's scale, the scale will be misshaped like the picture show. Is there a property or method to arrange the position of the scale?
-
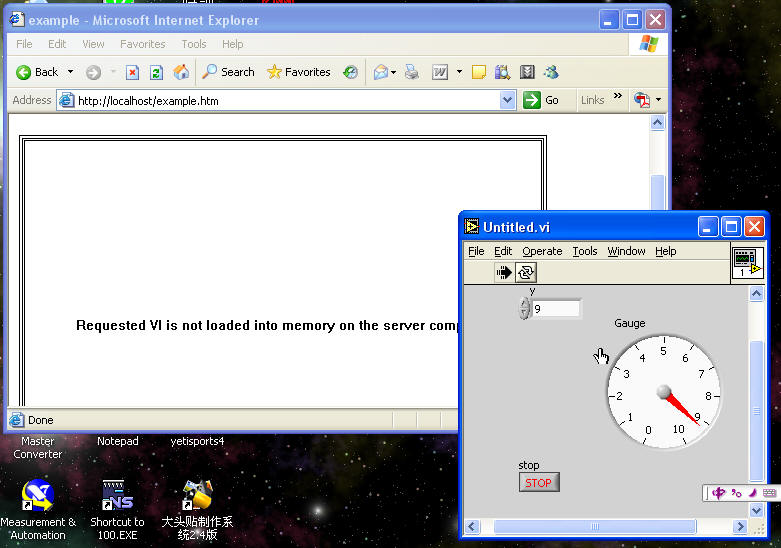
I follow the step you said, but I can not control the program in client computer.
I changed the following script
"<EMBED SRC=".LV_FrontPanelProtocol.rpvi71" LVFPPVINAME="Untitled.vi" REQCTRL=false TYPE="application/x-labviewrpvi71" WIDTH=518 HEIGHT=356 PLUGINSPAGE="http://digital.ni.com/express.nsf/express?openagent&code=ex3e33&"></EMBED>"
LVFPPVINAME=""
"" is my exe file name
What's wrong with that? -
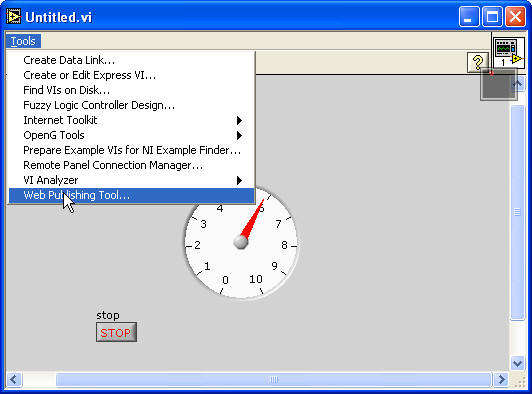
My main program is running in the Server Computer, and then I want the client Computer can visit the main program in Server Computer. But I don't want the users use the main program in editable status, so I build the main program into "exe" file. but I found I can't use the web publishing tool. so someone can give me solutions.
I hope my idea is clear to understand.
Skywalkerxp

-
We use labview for HVAC System Autocontrol
Skywalkerxp
-
-
Maybe you could use "Configuration File VIs"
-
It's not possible (yet) to create or remove a scale at
run time. Scales can only be created by right clicking on them and
Thank you Michael.
I think your way to solve this problem is excellent.
-
-
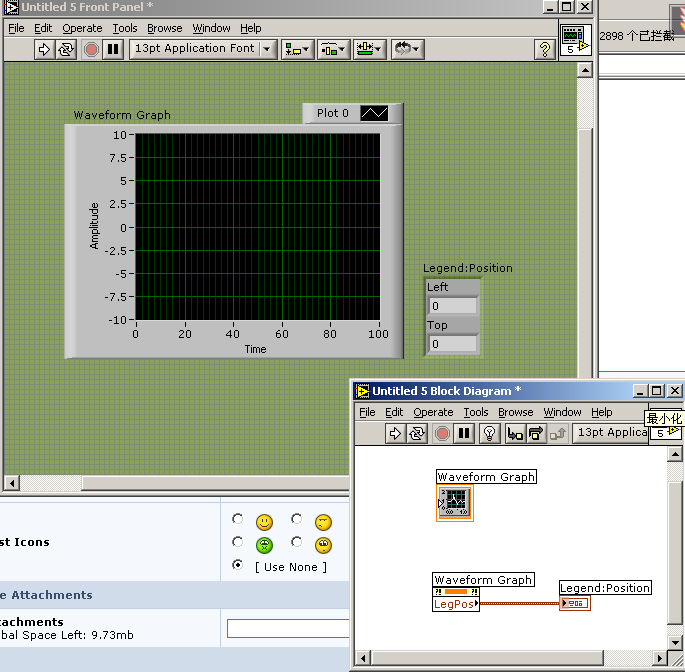
Skywalkerxp,
Right click on y-axis, and select "Duplicate Scale" - this gives you two scales on the left of the graph. Now right click one scale and select "Swap Sides" - this moves one scale to right side of the graph.
Next, right click on any series in the legend, then select "Y-Scale", then specify the scale to which you want to map this data.
See attached - two series, on two scales.
Cheers,
James
Thank you firstly, but maybe I can't explain my problem clearly. I want add a scale dynamic which means I want add a scale when the program is running, not in edit mode. so do you have a better idea?
-
When I have two points of temperature which they are very close even I can not see them very clearly, so I want to add a new Scale to separate them, One point of temp is associated with one Scale and other with the left Scale. I don't how to do it, In the graph or chart's properties I can not find the way to solve. maybe someone could help me! Thanks a lot!
Skywalkerxp
-
-
Really,let me try it.
How could you do that?
you mean choose the several object by using the Ctrl+click?


Print line by line
in LabVIEW General
Posted
I used CMD command like this ""Print /D:LPT1 D:\Data.txt" to finish my printing line by line. but I found this method has some limitation of DOS. e.g. When I want to print the character which DOS is not supported, then I need to install the Language package or some other software in dos envirnment. I wonder whether there is an activeX control which can solve my problem in windows mode not dos mode, so I can easy print the character which the operation system support.
Or maybe there is an other way to solve the problem of printing line by line.
Thanks in advance.