

vorlex
-
Posts
7 -
Joined
-
Last visited
Content Type
Profiles
Forums
Downloads
Gallery
Posts posted by vorlex
-
-
Hello,
I want to create a pop-up window to run, when I run the VI. The pop-up window to have a drop-down menu "Level" and 4 options: 1 ,2,3,4
Thanks
")
-
Thats my data can u help with it ?, Thanks!
-
12 hours ago, MikaelH said:
Thanks, but it dont work for me, or just i cant fix it to work

-
2 hours ago, hooovahh said:
Well you are using a Waveform Graph. This means that every X value is separated by the same amount. This is generally used for displaying something like DAQ measurements where you know each sample is always separated by some amount of time like 1ms. So you have a start time and date, you have the amount of time between samples, and you have an array of Y values which are every increasing on the X axis. If your data always adheres to these restrictions then you can use a Waveform Graph.
I'm still not fully understanding what the data is so I can't say for sure, but I suspect you actually want an XY graph, where you specify the X and Y value for each point to be displayed.
Do you want three lines? You also claim column "2, 3, 6" are X and 5 is Y. Do you mean index 2, 3, and 6, or the second, third, and sixth column? Remember LabVIEW starts counting at 0. But even so lets just look at "column 2", where are the Y values for this axis? Are they the same for all three X axis? Attached is a version that uses an XY graph, setting up the minimum and maximum as the values seen from index 1, 2, and 5. Three lines are shown each using one of those X Axis, and all using the same Y data from column index 4. These are constants on the block diagram.
you dont understand me right, because i dont explain it good
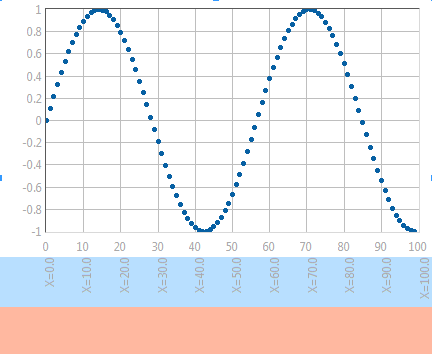
I want to look like that:
-
-
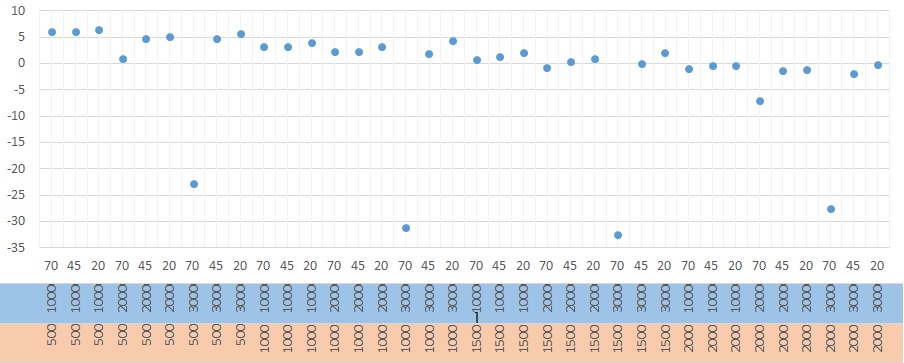
Hello, i want to create graph with 3x axis and Y axis
First Axis must be: 500 1000 1500 2000 and to repeat until the end
Second Axis must be: 10 20 30 and to repeat until the end
Third Axis must be: 25 55 85 and to repeat until the end
How can i do that?
PCAN Driver Question
in Code In-Development
Posted · Edited by vorlex
Hello,
Im using for PCAN Driver for communication with a CAN Device
I want to send via rs485 msg-s then to read them with the Peaksystems CAN
I have an issue with reading the values from CAN.
My program reads only the first value.
When I send msg and expect change there is no change in values I expect
Only E2 changes everytime I want to read, but not the next 2 values where I Expect change.
I guess Im missing something, but I dont know what.
Here is my program.
RS.zip