

topper99
-
Posts
12 -
Joined
-
Last visited
Never
Content Type
Profiles
Forums
Downloads
Gallery
Posts posted by topper99
-
-
If i need to place individual elements into a matrix, do something to the entire matrix then obtain individual elements from the answer for further calculations, how do i do the placing and obtaining parts? Are there special referencing functions etc that i should be using?
Topper99
-
I don't have LV7.1 installed right now so someone else will be more specific to your vi. However, if you want to view binary data in Excel, use an array of hex strings ("format into string.vi" format string = %x). Convert the array of strings to one string delimited with comma (for one Excel row) or CRLF (for one Excel column) and write the string of characters to a file. Excel functions HEX2DEC() and HEX2BIN() may be useful, too.
Cheers.
I also need to separate the string into 3 byte packages. my algorithm is to firstly look for the string header of 0x40 by anding my string with 0xc0. If this is true then capture the following 3 bytes. If not then these then also must be mixed and matched into an appropriate order. This i know can be done by shifting the various bits to where needed. Ive looked for some vi's on the NI.zone website to no avail but thats probably because i dont know what im looking for.
I start with a string data type and my hopefull output is a list of my three bytes in their correct order.
Can anyone help?
-
Iv been trying to decode the output of a serial mouse to a binary file to then obtain the coordinates of the mouse. I managed to determine these by using the aquire mouse functions last week but my boss has said that i need to use the serial port of my computer instead so that i can then ultimately run two mice in parallel.
From searching through examples on NI's website i cam across Convert ascii strings to individual bits.vi but when i come to save the output into a excel document all i get are squares and an error message from excel. (nothing new here!) Could someone point out to me where im going wrong please?
Topper99
-
Thats gr8. :thumbup: . You probably noticed on my design that there were two mice being read, or at least in position for that to be done. do you know how do distinguish the serial mouse from my ps2 mouse?
Topper99
-
Ok so i tried that and it seems to work, but then somethings happened to my coordinate capture section. It no longer works and i dont think iv done anything to it.
I believe that im doing the correct thing by using the shift registers but again i dont have any way of checking if it is right or not.
 Could someone shine a light on this for me?
Topper99
-
The example was from a search of "Mouse" and the vi was "draw graph on events.vi"
Iv since found that this example isnt quite right for the job, so i intend to go back to my original method and plot the position of my mouse on a graph using the mouse's relative coordinates. The problem I'm now experiencing is updating the graph at the time i move my mouse rather than waiting to press the stop button on my GUI.
How can i update the graph with my coordinates as the program runs?
Topper99
-
Ok. No worries, Iv since found an example on 7.1 which shows me exactly how to do it all. Cheers anyway.
Topper99
-
I'm not sure what you are trying to do, but I do know why this VI won't run.
- Replace Build Cluster Array with Bundle
You need to add the coordinates into a cluster. Bundle is the correct way to do this.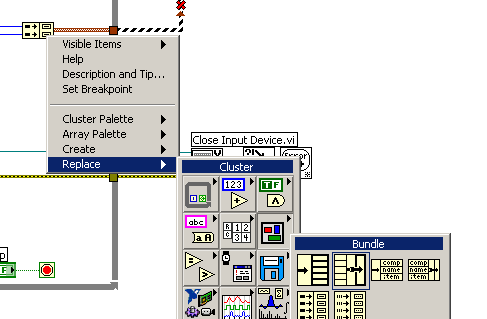
- Turn Auto-Indexing On
You need to make an array with all of your coordinate clusters. The easiest way to do this is by enabling indexing.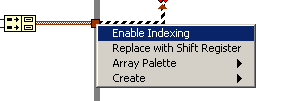
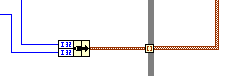
New Version:

Thats great thanks. So if i were to now wanted to plot the two sets of data, (2 horizontal and 2 vertical) onto the same graph i would do it how? As i say, im a complete beginner at this business and dont understand how a cluster of this gets to be a 1d array of that etc. Im sure its cause many problems before!
If i also wanted to update the graph as i used my mouse on the screen where would i have to put the plot icon?
If anyone can help me i'd again be very greatful.
Topper99
- Replace Build Cluster Array with Bundle
-
Another problem for the day. Now i have my data from my pc mice i need to display it in a graphical format. The problem lies in the formatting of the data input. I wish to use the plot multi - xy later to accomodate the two signals but have simplified the problem at the moment to just one set of points. This is what iv used in the attatched file below so you can see my problem. I cant understand why im going wrong. Is there someone again who can sort out my life?
Download File:post-586-1092060470.vi
Topper99
-
Cheers Didier. Iv now managed to get that sorted. As you say there is a problem with connecting two mice into the pc and distinguishing them from one another. I might have to "simulate" another mice with some user defined control boxes.
Thanks again.
Topper99
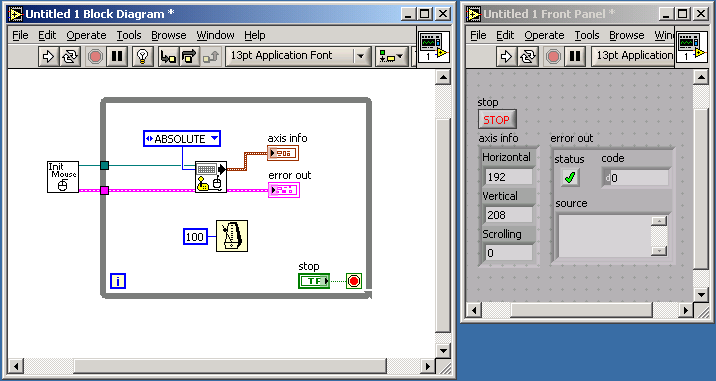
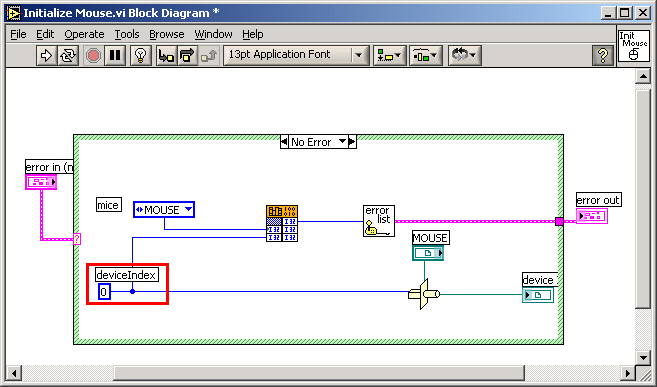
Hi,In the Palette menu under "Advanced>Input Device Control" you find the VI's Initialize Mouse.vi and Acquire Input Data.vi.
With these VI's you can get the mouse position of your actual mouse.
Download File:post-253-1092046089.bmp
To make a second mouse work on your computer, I don't know if possible - never tried.
If it works, then try to "hack" the Initialize Mouse.vi: change the constant from 0 to 1.
Download File:post-253-1092046391.bmp
Didier
-
I'm very new to using Labview 7.1.
 What i need to do is collect the coordinates from a serial mouse into labview and then plot these coords onto a graph. My ultimate aim is to then be able to determine a mathematical equation which would then determine when the coordinates of two mice held at a fixed distance from each other, and on the same axis, change when they are rotated.
 For the moment obtaining the coordinates from the serial ports is the problem. I have configured a port connection using the examples listed within labview 7.1 but the values that i am obtaining are all euro signs. Is there anyone out there who could suggest how i might be able to decrypt the info that i seem to be getting and process it into something more useful?
Thanks,
Topper99


Feedback loops and Cumulative Values
in LabVIEW General
Posted
I need to be able to calculate cumulative values for an X and Y data set and then produce a real time graph of the results. I get that i need to use a for loop and a set of shift registers but when i do this i get values which escalate at different increments to the input data. How should i do this properly so that i can then plot my cumulative value?