

ahlers01
-
Posts
63 -
Joined
-
Last visited
Content Type
Profiles
Forums
Downloads
Gallery
Posts posted by ahlers01
-
-
ZITAT(Ben Zimmer @ Jan 3 2009, 05:37 AM)
I use the services offered by http://www.origo.ethz.ch/, and I am so far very satisfied with it.
The big pluses for me:
- they also host closed source projects
- the server location ETHZ (the 'European Harvard' Eidgenössiche Technische Hochschule Zürich) should be a very reliable one...
- anf of course it's free
You might want to give it y try.
Franz
-
ZITAT(Ronnie @ Jan 30 2008, 08:49 PM)
Thanks, will it also work with pdf's containing text and drawings?Ronnie
It will work with all pdfs, but of course only text will be converted.
And don't expect that it converts all text correctly. Ligatures, e.g., are not converted AFAI remember. You've got to try it...
-Franz
-
ZITAT(Ronnie @ Jan 30 2008, 06:27 PM)
Hello,I'm trying to build a vi that is able to open and scan (search within) a pdf file.
Opening a pdf file with the use of ActiveX (class:iacroaxdocshim) is no problem.
Is there a possibility to open and scan (search within) pdf files using labview and how do I do that?
Thanks in advance
Ronnie
Yes, it can be done, but not in a straightforward way, AFAIK. When I did it some time ago, I used a (free) utility 'pdf2txt'. Google will show you where to find it. I called 'pdf2txt' with LV's 'System Exec.vi' to generate a temporary txt file, which then could be opened and analysed.
If I find my old VI I'll post it here..though it's not difficult to rewrite it once you have the pdf2txt.exe.
-Franz
-
I also thought about using the .NET file dialog since I want to include a file preview thumbnail within the dialog (something which is not possible with LV's built-in dialog, AFAIK).
I found this thread as a starting point for using .NET and of course was stuck then by the 'dialog not on top' problem.
There is a workaround though. (I couldn't get the other workaround offered in this thread to work)
By using a WinAPI call ('Move Window to top.vi' from lvwutil32.llb) the dialog can be brought to top:
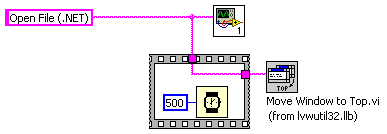
the subVI code is this:
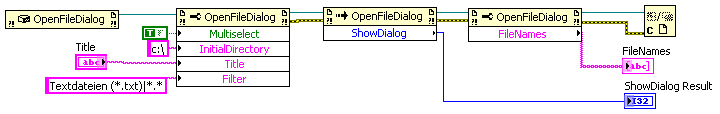
Interestingly this does not work when the 'Move window to top' call is in the subVI...
-Franz
-
ZITAT(yasmeen85 @ Dec 8 2007, 06:23 PM)
Thanks for replying..The first method so:-
I want to make a main front panel which have icons (choices) which lead to another front panels but with the main one still open...
So how can I make it by Labview??
Thanks again
Yasmeen,
you might want to have a look at the example
...\National Instruments\LabVIEW 8.5\examples\general\uievents.llb\New Event Handler.vi
The example is meant as an introduction how to use (user-)event handling in Labview, but it also may help to answer you question.
In the example 2 subVIs open their front panel when a corresponding button on the main VI is pressed.
The subVIs are declared to be 'modal' in this example: That means that no other LV window is accessible before the modal window is closed again. Therefore no two sub-windows can be opened at the same time.
If you want to switch off the 'modal' behavior please look under the topic 'Customize Window Appearance Dialog Box' in the LV help to see how to proceed.
However, in the given example switching off 'modal' would not make sense since the 'Analyze' sub-window can only do a meaningful job when the 'Aquire' sub-window (or subVI for that matter) has terminated.
Whether a subVI with opened front panel should me made 'modal' or not depends on the intended application.
Hope this helps,
-Franz
-
I am 'searching' the LabVIEW VIs 'denoise' and 'detrend'.
We have the LabVIEW pro version 7.1. Is it possible that these BVIs are not available in 7.1 ?? If yes where can I get them ??
AFAIK those VIs are part of the Wavelet toolkit, which needs to be purchased separately
addition:
Searching for 'detrend' in www.ni.com I found that there also is a 'detrend' function in Mathscript.
And the wavelet toolkit I couldn't find anymore, maybe it is now integrated into the Advanced Signal Processing toolkit
-
There's a weird piece of LV functionality that might help with this. Drop an subVI onto any block diagram, then popup on it and choose "Enable Database Access". This puts a funky yellow halo around the subVI with extra terminals. This lets you do FP querrying for historical values of the FP of the chosen subVI. Details are here:
http://zone.ni.com/reference/en-XX/help/lv...Logged_FP_Data/
This is a feature that doesn't get used often, but I've always thought it was an interesting idea. It seems like there ought to be more you could do with this "halo" concept, but it's never really been expanded on, and most LV developers think its kinda lame. Still, it might be interesting for you in this case.
Thanks, I knew that one and I used it long time ago for retrieving data that had been measured with a 'quick&dirty' assembled aquisition program. I hadn't even found the time to write the 'save to file' part of the VI at that time and therefore used the data logging feature of LV. In order to retrieve the data for processing later I used this 'enable data base' access trick. It all worked nicely but at one point I changed the main VI (added or modified controls) and didn't save the old version. I could no longer access the old log files, since they are binary and could only be read when the controls and indicators were exactly as specified in the log file's header part.
After that bad experience I stayed away from the log files, but I agree that the technique might be helpfule here. I'll check it out.
But for now I finished the XML approach and I attach the first version here, maybe it is helpful for others:
Download File:post-833-1163876298.vi
regards
Franz
OpenG has a VI to save the front-panel contents of a VI into an INI file. That's the fastest route I know.Normally I use the cluster to INI file function
Ton
Thanks for the tip, Ton! I actually had thought about that but I had problems lately to download the OpenG software. Do you know a working download link?
Franz
-
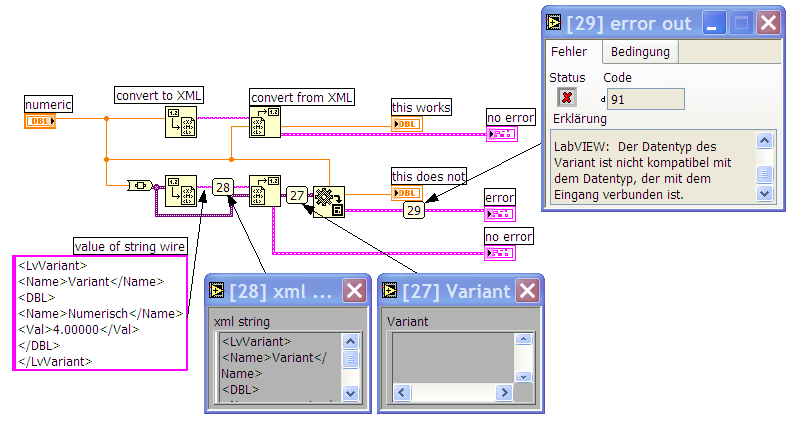
I can't get the 'Convert from XML' function to work when the input type is a variant, see attached code.
Am I doing something wrong, or is this a bug?
Code picture:
Code:
Download File:post-833-1163832727.vi
********** UPDATE***********
I found the answer to my question at this ni.com site where it says: "Although you can flatten LabVIEW variant data to XML, attempting to unflatten variant data from XML results in an empty LabVIEW variant". So it's a feature, not a bug.
Background: I wanted to write a VI which stores all control values of its calling VI to an XML file, and reads them back. In my first approach I had accessed the calling VI's 'Panel' refnum to obtain the Controls[] refnum array and from them the Value property, which is a Variant. That I wanted to write and read to XML. This does not work due to the reason above. I will now try to use the 'Get all control values' method node to access the calling VI's controls. That method delivers a (flat data|type desc) pair for each control, which should allow to do what I want.
BTW: A VI doing what I describe above should have been written by someone already, but I couldn't find it. I'd be grateful if there is such a VI and somone can point me to it.
-Franz
-
does anyone else find Search and Replace Pattern.vi useless?
It seems to me that you can't remove all the <HTML> tags from a string with it.
I substituted Match Regular Expression for Match Pattern, creating a
new VI called Search and Replace Regular Expression...
To me it seems that Search and Replace Pattern.vi IS able to remove the tags, see attched example.
Can you post a specific example where it doesn't work? (Or maybe I misunderstood what you want to achieve?)
-Franz
-
---snip---
Not only that, but we want to be able to dynamically load one of several XControls, all sharing an interface, just as one might dynamically load different VIs that have the same connectors. (Why? So we can make an app that loads "plugins" that can have independent event loops, properties, and state -- in other words, we want objects -- which is why we want XControls as plugins.)
---snip---
mpa, if you listen to the Mistaken Podcast you will know that a native OO in LabVIEW is not too far in the future. It might be worth while to wait for it.
-Franz
-
No one is able to do it ?

OR advice me ?
I have added in the datas required
I had a look at your equation. If I read it correctly, you can substitute z:=x+a*y and then bring the equation to the form x=f(z).
You could then try to use this for non-linear fitting, treating x as the dependent and z as the independent variable.
Also I would recommend you normalize your values in such a way that reasonably sized coefficients occur, not ones which differ by 23 orders of magnitude. That would probably help to avoid numerical errors
-Franz
-
I do have lines in my ini file that are needed to see the additional properties. I guess this one must be one of them.
In your labview.ini file add one or both of these additional line:
SuperPrivateScriptingFeatureVisible=True
SuperSecretPrivateSpecialStuff=True
When you restart LabVIEW you should see this property.
Is there somewhere an up-to-date listing of these undocumented .ini settings?
I used to look them up on Brain Renkens page http://labview.brianrenken.com/INI/ (and the LAVA FAQ http://forums.lavag.org/index.php?showtopic=299 also still refers to that URL), but I cannot find this supersecreteprivate stuff there.
regards
Franz
-
Strange. Seems like Salford Fortran need some kind of run-time library, very odd for this simple code. I found the salflibc.dll in a "redist" folder in the salford installation folder. Here it is. or not?. The board complains and sends a message that it will not accept i file "with that file extension". I zipped the file, and you need to unzip it along with the others i guess. If it complains about more i think you can install the Salford FORTRAN package or just comment out the call to those dlls, since the c-dlls are almost exactly the same execution speed.
The salford fortran is freely downloadable from http://www.silverfrost.com/32/ftn95/ftn95_...nal_edition.asp
o.k., I got it running now.
The execution speed results you obtained are indeed very interesting. I basically could confirm all the timings you obtained.
In addition to your tests I added one where the whole array is passed to the subroutine (which contains what you call 'inline' code). Interestingly the subroutine performs slightly faster when you set the priority not to 'subroutine', but to 'time crritical' only.
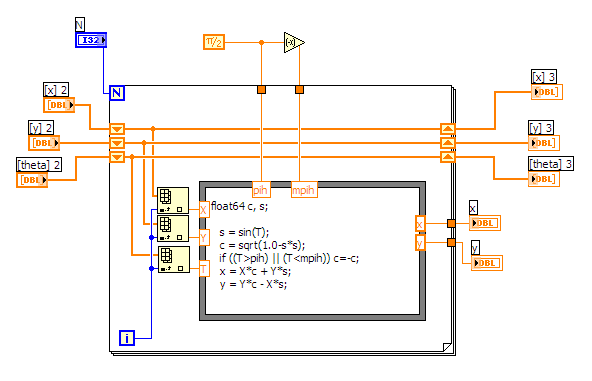
The fastest pure-LV solution i came up with was one where the formula node (with external indexing) is put in a 'time critical' sub-VI, and where the cos calculation is replaced by sqrt(1- sin*sin):

It is nearly as fast as the lcc-array solution, as the green line in the following diagram shows (the diagram lists msec used for 500000 array length):

So the LV solution is only 10% slower than the lcc one (and faster than fortran), unless you speed up the dll code by avoiding the cos calculation there, too.
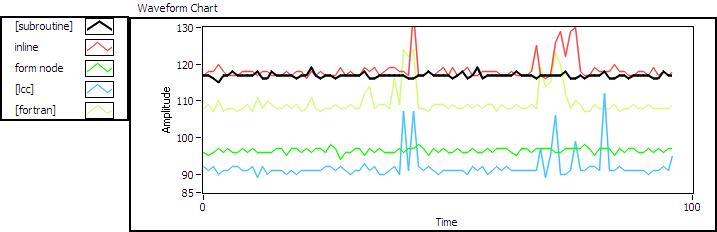
Remarkably, the timings of the two LV-subroutine solutions (black and green lines in the diagram) are much more constant than the timings of the inline, lccc and fortran solutions, which sometimes are longer due to some backgrounf activity in the system. That becomes especially obvious when I did not turn of my PC's DSL network. The following diagram shows the timings with network on (in the above diagram it had been off):
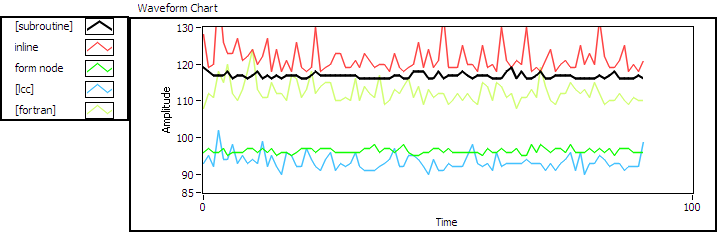
The black and green curves are 'unimpressed' by the background activity, the others obviously not. (I wonder if they become more stable, or even faster, when 'wrapped' into 'time critical' subVI)
In conclusion, I would say that it is possible to have a fast floating point meth in LV which nearly reaches a DLL implemetation. Inline code is not necessary, IMO, since the 'time critical' subVI method can be used.
BTW:
I obtained my results with a beta version of LV 8.2, since I had all older LVs uninstalled. I attach a copy of my VIs which is saved for LV 8.0:
-
Hi bsvingen,
LV complains about a missing 'salflibc.dll'. Could you post that one, too?
-
I noticed that LV 8.0.1 (on Windows XP Home edition) freezes during startup when the clipboard contains some Mbytes of data.
Here's what I did:
- Open a text file (2.7 MByte ASCII data) with notepad
- select all text
- press Ctrl-C
- start Labview
result: LV hangs (showing the 'Finishing Initialization' message on the splash screen, lower right corner)
cure:
shutdown LV
remove data from clipboard
start LV
Is this behavior also seen by others?
-
I created a simple XControl. It consists of a switch and a LED light. When the switch is on the light is on and vice versa. Some of my end users like to have to light associated with an on/off switch so I will be using this alot.
Is there a way to resize the elements that make up the XControl for each control I drop into a new project? All I have been able to do is resize the whole thing. I might want to only resize the LED light or the switch. Is there a way to do this or is the container the only thing that I can resize?
I checked out the example and could only resize the container there too.
Such a control is a standard in Labview since version 2.52 (or such). It's called LED button. Or did I miss the point about your new XControl?
LED button:

-
Hi,
I'm having serious problems installig LV8 on my Win2k machine.
After entering the S/N and selecting the components to be installed I started the installation process and got an error message telling me something about trouble with certain transform packages and that I should check the transformpaths to be valid.
I'm installing the German version - so the exact message is:
"Die NI Uninstaller Installation ist aufgrund des folgenden Fehlers fehlgeschlagen:
Fehler bei der
-
If you had to introduce this concent to a new developer, what would you call LV2G's? Obviously there is some historical significance to the name, but it doesn't do much to describe the concept. How about "Uninitialized Shift-Register Globals" or "Uninitialized Shift-Register Data Store"? Any thoughts?
I usually call them 'intelligent globals'
-Franz
-
I did do a search but didn't find what I need.
I have a multi-line string and need to search for a small string in each line and if that line contains it i want to pull that entire line into another string. So for example:
My mutil-line string looks like this
01 02 11 22 22 22
01 02 00 22 22 22
01 02 10 22 22 22
01 02 11 22 22 22
01 02 10 22 22 22
01 02 11 22 22 22
01 02 00 22 22 22
And my search string is:
"10 22"
So my output would be
01 02 10 22 22 22
01 02 10 22 22 22
Maybe transfer the multi-line string into a cluster of strings would be a better idea ?
You don't need the OpenG tools, it can of course be done with plain LabVIEW:

Download File:post-833-1135437245.vi
-Franz
-
HI FRANZ!
Thank you for your explanation. I thin the problem is when i filter the original data, i would lose some geometric details and i think it*s better to filter the 2nd derivatives.
There should not be so a big difference, between the method with filtering the original data and filtering the 2nd derivatives!??
Is that right??
Best regards,
PETER
Peter,
whatever you do to your data depends on what information you want to extract. If you want curvature (=2nd derivative), go with method iii) above, I can hardly figure a better way to find a 2nd derivative for noisy data. If you want to compare complete curves, and the curvature is only a tool you use for comparison, there might be better ways to make a reliable comparison, but that depends on details of you setup which I do not know. But in any case, you should try to reduce the noise in you data beforehand as good as possible. E.g. I've seen 2 or 3 outliers in your data (outliers in the X-data set) which you should try to avoid or, if unavoidable, exclude from the analysis.
Another comment (again without knowing the details): if a derivative is the signal of interest, it is often best to do some kind of modulation spectroscopy, i.e. you modulate the signal which represents your x-axis sinusoidally with a small amplitude and detect the y-signal with a lock-in amplifier. Then you measure directly the 1st deivative with a much better signal to noise ratio than calculating it from y(x) data. But probably a modulation is not possible in your setup?
good luck
Franz
-
Hi Peter,
Method iii is the one described in the 3rd paragraph of my last posting:
"Then the best solution would be to perform a polynomial fit to a subset of the original data which is centered symmetrically around point (Xi,Yi). Take 2N+1 data Xi-N, ... , Xi, ... , Xi+N (and the corresponding Yi-N,...,Yi+N) and fit a polynomial, then take the (analytical) 2nd derivative at point Xi as an estimate of the 2nd derivative of the original dataset."
N is the number of data to the left and to the right of a specific data point i, so the total number of data taken for a polynomial fit is 2N+1. Data points i towards the beginning and end of the dataset may have less than N points to the left or right, and then of course less than 2N+1 data are taken.
Example for dataset of size m:
For N=2 the following fits are performed:
for i=0 points 0,1,2 are fitted
for i=1 points 0,1,2,3 are fitted
for i=2 points 0,1,2,3,4 are fitted
for i=3 points 1,2,3,4,5 are fitted
for i=4 points 2,3,4,5,6 are fitted
.
.
.
for i=m points m-2,m-1,m are fitted
I think what I implemented is called a smoothing polynomial filter, but here it is not used to filter the original data, rather only the 2nd derivatives of the data are obtained. If for each data point Xi a new Yi were computed from the polynomial and would replace the original Yi, one would indeed have the implementation of a smoothing polynomial filter. The VI I posted can be easily modified for that.
regards
Franz
-
-
Hallo Franz!
Danke f
-
Ich habe bei der 6er Version die Vollwersion. K


Geek Credentials
in LAVA Lounge
Posted
ZITAT(Kevin Payne @ Apr 21 2009, 09:33 AM)
If you have a PDA, you might be interested in this nice emulation...
I use it on my HP iPAQ, so I don't have to unlearn RPN...