Search the Community
Showing results for tags 'save'.
-
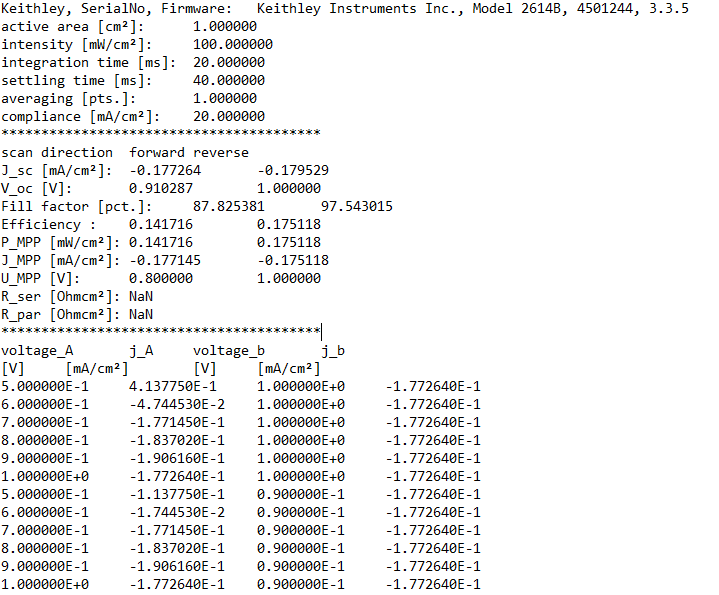
Hello dear Labview friends, Main program background: (if somebody wants to know) Okay as roughly speaking it is a 6 point measurement on a 3 contact tandem solar cell. So actually it is two 4 point measurements where 2 measurement points overlap (so one contact has 4 measurement pins instead of two) Which is why we get two data (voltage, current for A) for the first 4 point measurement and 2 (voltage, current for B) for the other While we apply a constant voltage to one contact (with Channel B), the other one goes through all voltage steps (Channel A). So the inner loop. But since the measurements are connected to each other, when we increase the voltage in channel A, not only the current of channel A changes, but also the current of channel B. So everytime we perform the inner loop, we have to measure both channels. (is a bit crazy I know ). Thereby 4 measurement data are produced Channel A (voltage and current density) and Channel B (voltage and current density). When the first run of channel A is finished, the voltage of channel B goes to the next voltage value and channel A starts from the beginning and both Channels are measured. An Example for a potenzial Output would look something like this: The simplified VI I send here has only the functions needed to show approximately what is happening, so it is not too much to look at and you don't have to spend years to understand:) Currently 4 data are "measured" (random numbers) and are plotted in two graphs. The values are the replacement for the measured values taken for the 2 channels from the Keithley 2614B. While running the Program: Before you click on Start you can select a .txt file at Save Data where you want to save the data at the end. If you press Start and have not yet selected one, a message appears that you should do it and you must select a .txt document. So you have to create a .txt to move on After the measurement, the data should then be in there. I am quite honest I have no idea how I can do this best:/ (Probably but my Array in a cluster, but how to save it hmmm...) Finally everything should be saved in a .txt file. The header of the .txt simply outputs the values that were entered at the beginning of the measurement + an IDN? Output (can be ignored for now) As second there were some calculations (can be ignored for now) and the third are the actual measurement data for our case its: voltage_A, Current_A, voltage_B, Current_B Normally in the old version the measurement data comes into the "Write To Spreadsheet File.vi" as stream of a 2DArray of doubles which looks like this: (here only channel A was measured in the old test program, but in principle there would 2 rows more) It does not even have to be the best solution if it works I would find it already awesome. I thought I could simply build a 2 D array during the measurement and then send it to the save area. Unfortunately this did not work. Or maybe at the lower Loop where the graph is plotted then collect the measurement data into a 2D Array and return it to the "save" area Would be awesome if you could put your potential solution in the VI i sent along so i can see and learn what you did, but iam grateful for every idea:) I wish you all a nice week! Sebastian How to Save Data.vi
- 4 replies
-
- save
- measurement
-
(and 1 more)
Tagged with:


