

hfettig
-
Posts
109 -
Joined
-
Last visited
Content Type
Profiles
Forums
Downloads
Gallery
Posts posted by hfettig
-
-
Hi Sarah,
I have been using Musicmatch Jukebox for a while and it works quite well. Furthermore, last time I checked the free version let you convert a CD into MP3s
Cheers,
Heiko
-
If you select the paint brush tool from the tools palette and right-click on the border of the loop of sequence you can choose the colour.
-
Actually, it is possible to do what you want to do. It took a bit of creative programming, but I was able to do it. Please see the attached vi.
If you want the change of the value to trigger a value change event for the array, change the propertynode from 'Value' to 'Value (Signaling)'
Just as an aside, would it not be more convenient to just have the user type 'NaN' into the control? That's three key strokes as compared to two and a lot less programming effort.
Cheers, Heiko
-
I have a string variable, which contains an integer number representing a floating point value with one decimal., e.g. -321 -> -32.1
In order to convert the string to a double variable I use the 'Decimal String To Number' function and divide the result by ten. This works fine if nothing or an Integer constant is wired to the default value. It properly converts -321, 321 and +321.
To avoid the coercion dot at the devision function I wired a double constant to the default value of 'Decimal String To Number'. This changes the output wire to double and the coercion dot disappears. So far so good. However, now only 321 is properly converted -321 and +321 are not converted and the default value is put out.
The same happens for extended, single, and any unsigned integer values wired to the default value.
Granted, I can easily work around the problem, but I wanted to check if anybody has an explanation for this behaviour.
I tried it in 7.1, 7.0, and 6i: same behaviour everywhere. :headbang:
Cheers,
Heiko
-
In Labview 7.1, if you use a square LED as a control and set the mechanical action to 'switch when released' or 'latch when released', the 'True to False' and 'False to True' colours seem to get ignored.
I only want the colour to change once the mouse is released, but I could not find a combination of the four colour entries that made that happen. It works fine for the boolean strings that are displayed.
This is the first time I have tried this, so I do not know if it used to work in previous versions.
-
Have you considered running two loops in parallel?
The first loop constantly generates/gathers the data and writes it into a write buffer.
The second loop checks the time, if 1s is up, it updates the header, if not, it copies the write buffer to an output buffer and clears the write buffer. Then it writes the output buffer to disk.
This way you decouple the storage part of the task from the gathering part. You just have to avoid the gathering part to write to the buffer while the storage part is clearing it. This will cause a slight delay in you gathering routine, but only for a couple of milliseconds.
I attached a buffer vi. Take a look at it and modify it for your use. In the gathering loop, use the 'add to buffer' action. In the storage loop use the 'read & clear buffer' action. Then you can just loop through the buffer elements to save them. Use the 'Initialise' action before you add the first point.
-
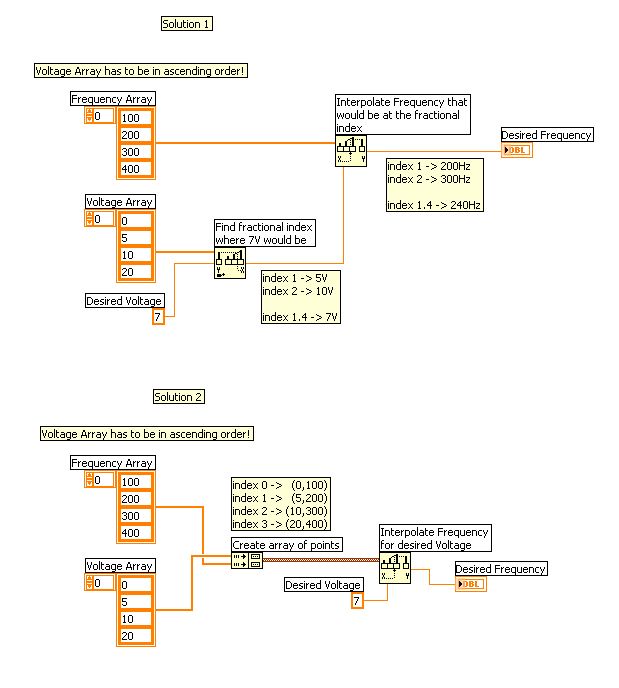
As to the first part of your question, I am not sure I understand exactly what you want to do.
But I can help with the interpolation part:
There are two ways to do this. You can doing by using your two arrays. Then you have to interpolate twice. First you find the fractional index that 7V would have in your voltage array. Then you find the value that corresponds to this fractional index in the frequency array.
If you combine the two arrays to an array of points, then you can simply use one interpolation function. Everything else is done for you. Make sure two wire the Voltage array to the first input.
In both cases the voltage array has to be in ascending order and the values in the frequency array have to be at the same positions as the corresponding voltage values.

-
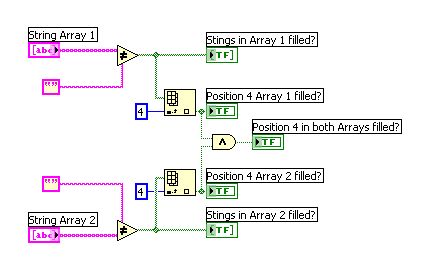
If you take one of the sting array controls and an empty string constant, wire them both to a 'not equal' operator, the result is a boolean array. Each element of the array shows you if the corresponding element of the string array is filled or not. Now if you check position 4 of the boolean array it shows you whether that position is filled. Do that for both arrays and 'and' the results and you will know, whether both positions are filled.

Gaussian distribuition
in Application Design & Architecture
Posted
I am not entirely sure if I understand your question, but I think you are looking for the histogram VI.
If you feed you measurement points into the histrogram VI it will sort the points into bins of equal size (based on the number of intervals you specified), therby giving you a plot of the distribution of your measurement points. You can then visually confirm gaussian distribution or you can use one of the curve fitting VIs to fit the histrogram to the gaussian distribution function.
Hope that helps.