

Xrockyman
-
Posts
27 -
Joined
-
Last visited
Never
Content Type
Profiles
Forums
Downloads
Gallery
Posts posted by Xrockyman
-
-
Thanks for your quick answer:)
Regards,
Sylvain
-
Dear Labview users,
In the front panel control menu there is a control "File Path Control", with this I can get a path to specific file. What I want is the same thing but only to folder. I don't want to open a file I only to choose a path.
Thanks in advance and regards,
Sylvain.
I'm sorry I have pushed twice the submit Button.
Regards,
Sylvain
-
Dear Labview users,
In the front panel control menu there is a control "File Path Control", with this I can get a path to specific file. What I want is the same thing but only to folder. I don't want to open a file I only to choose a path.
Thanks in advance and regards,
Sylvain.
-
Thanks! With NaN "constant" the points are not plotted and I'm able to do "clean" join of the tow parts of the graph with different colours.
Regards,
Sylvain
-
Dear users,
It is possible, when using "XY Graph" to use two colours for the same plot? The objective is to have a colour from the beginning of the plot to the a certain point, after that specific point I want a different colour. I've searched in the property nodes but it is only possible to change the coulor of the intire plot.
Another solution I experiment is to divide the plot in two and put "zeros" in the begining and end of each plot to give "sensation" of continuous plot with only the color changing, this allmost works but the changing point stays a bit "ugly" and this is not a solution..
Thanks in advance and sorry about of the long post:)
Regards,
Sylvain.
-
QUOTE (normandinf @ Jul 31 2008, 03:47 PM)
Place the object outside the tab control and use the arrow keys to move it in place. Don't drag-and-drop or it will be inserted in the tab control.EDIT: SAME THOUGHT, TOO LATE!
Thanks it worked! And because the object is out of the tab it stayed with a cool shadow:)
Regards,
Sylvain
-
QUOTE (ned @ Jul 31 2008, 03:06 PM)
You could place the control on top of the tab, rather than within it, and then it would be visible on all tabs. If you need to hide it for some tabs, you can use the "Visible" property to hide it only when necessary.Another approach would be to use two tab controls; a large one containing the common items, and a smaller one with the individual tabs. Place the smaller one in front of, and on top of, the larger one. Hide the tabs for the larger, background one, so it looks like there's only one tab control (you might need to play with colors and transparency, but it's probably doable). Make the larger background one an indicator, and set its value based on the value of the front one.
Thanks for your quick reply,
Your first solution seems to be the best on. I understand how to make the object disapear playing with his property node and the tab control but I can't put the object on top of the tab, it stays allways inside! I tried to select the option "Move to front" but It stays allways inside:(
Thanks and regards,
Sylvain
-
Dear Labview developers,
I have a simple question, in a front panel is it possible to make visible an object in several tabs of the same tab control? There are several objects that I want to repeat and I think repeating the same code is not a optimized solution.
Tanks and regards,
Sylvain
-
QUOTE (TobyD @ Jul 29 2008, 06:20 PM)
It's amazing how simple a solution can be once we understand the problem :thumbup:Lol, that's wright, my bad English and my intent to have a general, not so specific solution did not help very much with the understanding of my problem. Thanks to you all, I have now the perfect solution for my problem.

Regards,
Sylvain
-
QUOTE (TobyD @ Jul 29 2008, 04:42 PM)
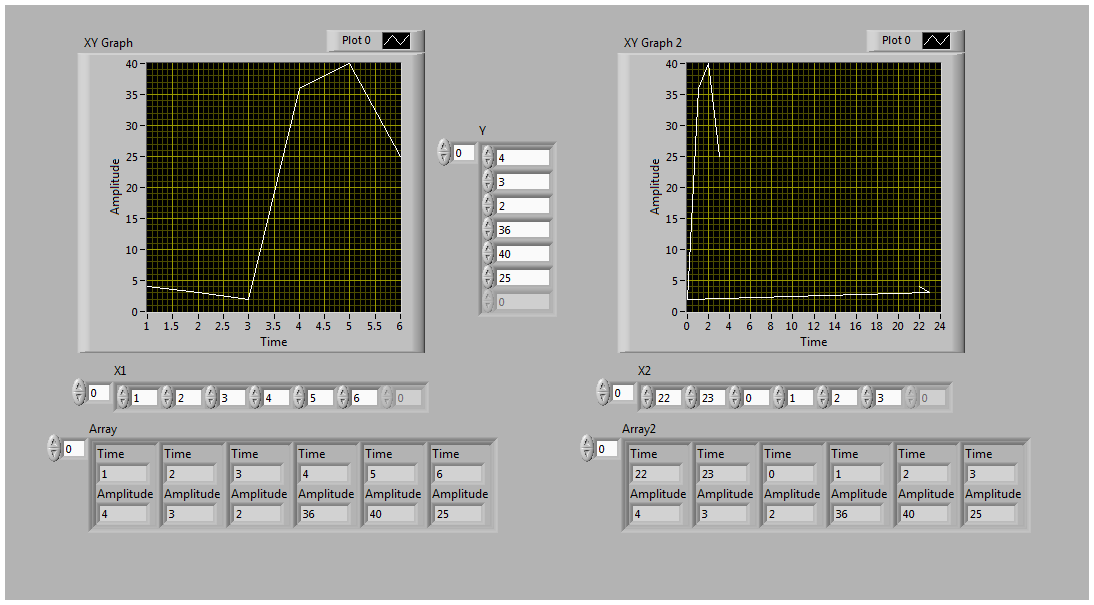
Imagine that 'y' values for example represents temperature of something, and my 'x' axis represent time in hours. If for example now are 4H the axe 'x' for the last 6 hours will be 22, 23, 0, 1, 2 ,3, . Labview attributed the points correctly but reordered the 'x'.
Thanks.
-
QUOTE (shoneill @ Jul 29 2008, 03:30 PM)
Sylvain,LabVIEW isn't re-ordering anything, you are.
The graphs look more or less correct for what you're showing.
What do you think the graph SHOULD look like?
Shane.
All I want to do It's the second plot to be exactly the same as the first one except the time time axle. I want the time axle time shows the same values and in the same order that the array below.
Thanks.
-
Dear users,
The example below It's me trying to plot an XY Graph.
The first plot all appears as I want because the 'x' is by order (1,2,3,4, etc). I want that the second plot to exactly the as the first but I only want that x shown in this plot is 22, 23, 0, 1, etc. The issue here is that labview reorder my x.
I tried to put also the array on top of the graph but this is not a "clean" solution.
Sorry about my bad English but I think the picture will be clear what is my objective.
Regards,
Sylvain.
-
QUOTE (neB @ Jul 23 2008, 06:14 PM)
Agreed. I can not recall any cases where slugish VI performance was fixed by changing the priority.Ben
Thanks, that is true. The better solution is to put parallel loops handling my menus and controls and I put these interacting with the rest of the code with global variables.
Regards.
-
Thanks that was just what I needed:)
-
Hello,
Is there a way to give execution priority to a certain code or VI? My problem is that I have some interface controls that I want to execute immediately for the user doesn't feel that the program is slow.
Thanks in advance:)
Regards,
Sylvain.
-
QUOTE (mross @ Jul 15 2008, 11:56 AM)
The set up you have is sort of a one shot. You see that initial count control? That has to be redone so you must expand the VI to a lower level to find that function and get it inside the loop. You will also need to institute a Stop function inside the loop. The simplest thing might be to look for a different example that extends the VI to be reset, or another counter VI that resets to get an idea. (I apologize, but I haven't used counters much with DAQmx).This is point where I would start using an Event Driven Queued Producer Consumer architecture. You have a fast machine operated function (counting) and a slow human input GUI function where you pick on screen and it resets and perhaps begins or waits for a signal, this is what the EDQPC is designed for.
Mike
Thanks for the tip, I've search around and I didn't find any quick or easy solution, so what I'm going to doo is simply not reset de counter. I know what it is his limit, so I can solve my problem from that characteristic.
Thanks and regards.
Sylvain
-
QUOTE (mross @ Jul 14 2008, 05:24 PM)
Please check the following in this order of priority:The counter must be wired correctly.
The signal must be correct.
The channel must function.
Then finally, the VI must work.
Be certain that you have correct wiring to the counter. There is a note in the Block Diagram directing you to information about correct wiring.
The signal must adhere to TTL specifications (if it never rises above 2.5 volts, or never drops below 0.8 volts there will be no valid change of state to count).
Any mechanical switch used in this way will need electronic debouncing. The counter is sensitive enough to see the contacts settling, even if the time is very short. This will produce many counts instead of one count - therefore this not your current problem, but you WILL have this problem without debounced switches.
You should set up a task using (MAX) Measurement & Acquisition eXplorer and be sure to test the task and circuits in MAX before procedding to use the channel in a LabVIEW VI.
If you successfully get the counter to work in MAX then we can talk about how the VI is operating.
Good luck,
Mike
Thanks for you quick answer:) I allready my problem solved, the counter is working correctly with a debounced button.
I have another question, how can I reset the counter while the program is still running?
I tried whith a case structure, when it is "true" to close the daq task and after start it again but this solution doesn't work, an error apears: "Error -50103 occurred at DAQmx Start Task.vi:3
Possible reason(s):
The specified resource is reserved. The operation could not be completed as specified."
Thanks and best regards.
Task Name: _unnamedTask<1B>
-
Hello,
I a NI DAQPad-6015, and I'm trying to use a counter from that hardware. I have tried to use an example but I simply can't put it working. The example as the following name:"Count Digital Events.vi".
In my hardware I've do counters and I tried to connect a switch( this is the digital event that I'm trying to count) in evry pin of the counter and nothing!
See the image below:
Thanks in advance and sorry about my bad English:)
Regards.
sorry about the image, it was not compressed:)
-
QUOTE (normandinf @ Jul 11 2008, 01:47 PM)
Thanks for your quick answer !
Building an array is the quickest and simple solution
Thanks ans nice weekend for you all
QUOTE (Xrockyman @ Jul 11 2008, 02:31 PM)
Thanks for your quick answer !Building an array is the quickest and simple solutionThanks ans nice weekend for you all
I wanted to say "Thanks and a nice weekend for you all"... my wonderful English...
-
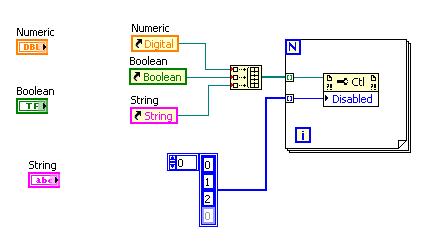
Hello, I am using a "log-in" system and I want do disable some controls. To do that I'm using the property node "Disable". The problem is that I have a lot of controls to disable, is not possible to create a "property node" for a group of control or other objects?
Thanks in advance.
Regards.
-
Hello,
I've made a easier solution, maybe is not so pretty but is easier to understand
It consist using rings and property nodes(in this case "visible" and "disable"). My vi goes on the attachment. Regards.
-
QUOTE (gleichman @ Jul 9 2008, 02:34 AM)
Thanks, that is just what I wanted, now I only have to do is to make the "stuck" in one place and allways visible.:)4
Regards.
-
Hello,
It is possible to do "cascade" menus in a VI using 2 or more "ring menu"? I wantd to do something like this:
Thanks and sorry about my bad english.
Regards.
-
Path control, simple doubt
in LabVIEW General
Posted
Thanks for your quick answer:)
Regards,
Sylvain