

Minh Pham
-
Posts
171 -
Joined
-
Last visited
-
Days Won
3
Content Type
Profiles
Forums
Downloads
Gallery
Posts posted by Minh Pham
-
-
QUOTE (ASTDan @ Nov 3 2008, 01:04 PM)
URL eg. file:///d:/testSVN/test1/LV85 or http://svn/labview/test1/lv85 format
However if you use your window explorer, and goto your repository, you will find a folder name 'db' (i guess database). This folder probably
contains all revisions info of all your projects that connected to this repository. You will probably find the folder 'revs' in this 'db' folder.
Now inside this 'revs' folder, you can see there is a folder named '0'. All of your files/folders and their associated info should be in here i guess. You can check it by adding file(s) to the repo and see it comes up in this folder in the form of id number (0, 1, 2 ,3....), it increases the number by one everytime you add a file. YOu can also check the file size as well to verify this.
I think this is the way that Tortoise SVN creates its own copy of the file in the repo using its own format. The file that SVN created has all the required info like author, time, rev number, clients, etc... and the data. I think this data is added to the top of the original data so that SVN willl be able to do compare, checkin, checkout, revert .... operations.
It can be something else complicated, but this is my guess.
Hope there will be an expert jump in to clear out some confussions.

-
QUOTE (vijay shankar @ Nov 1 2008, 12:49 PM)
I have a serial port in the controller, but i dont have any adapter for that..I need to develop the program in an XP system and so i just need an idea of how to go about this project.
I basically have the following questions,
1. to connect the controller to my system, do i need a rs232 cable (from the company?).
if so, do i need a PCI card installed in the system? any specific card?
or can i have a rs232 to usb adapter and plug that into my system and still develop my project in labview?
2. to program in labview, should i need a instrument driver to send commands to the controller?
if there is something of this sort, then what should i get from the vendor who supplied the controller for me..
to be specific, the controller is a series 800 thermaoelectric cooler controller from alpha omega instruments
You do need a serial cable to connect the device to the PC, i think a normal RS232 cable is fine as long as the device has a
D-SUB 9 pin RS-232 at the back (i believe it has according to the specs i found through its website.)
You dont need any PCI card for this as serial communication is enough to control and receive msgs between the PC and the device.
RS232 to USB should be fine but if you can use the straight serial to serial cable as it is simple and cheaper that way i reckon.
VISA driver from NI-VISA APIs should be enough for you to control this device if this device accept this way of communication. However I
did have a look at the specs, it seems like the device using MODBUS protocol for communication with PC, so it is a good time to search around
for some MODBUS vis or library for labview and learn it. If you really into it, i suggest you can write your own vis for this communication as it will help you understand LabVIEW as well as MODBUS communication.
After you've done with the communication task. YOu are pretty much set for do whateva u like with the temperature controller, you can SET temperature, GET temperature, etc... by sendding data/commands or syntax through your communication vis to set a certain modbus registers...
Good luck
-
and here is the new website homepage:
-
QUOTE (labviewRTS @ Oct 29 2008, 12:42 PM)
when you say that, what do you mean? Do you mean it is not recommend to use race conditions. By the way, may I know whether race condition can use in VISA and serial links?what do you mean by 'use race condition' ? That is something that we want to avoid not 'use'. :!:
Please look up for the definition of the race condition within LabVIEW due to dataflow nature.
Your question would be: May i know whenever race conditions can be Occurred if I use VISA APIs for my application?
I hope you can find the answer to this matter (google or it is already in the Basics II book !?)
Regards,
-
QUOTE (Aristos Queue @ Oct 28 2008, 11:23 AM)
The 2D picture control cannot do what you're asking for. The 3D picture control can.Take a look in the palettes at
Functions>>Programming>>Graphics & Sound>>3D Picture Control
The 3D API is simply a much more modern API than the 2D API. You can draw 2D pictures with the 3D API. I know no more details than that... check the online help and the shipping examples for more info.
Can you post an example AQ, I dont get it :headbang:
I did look at couple of examples that come with LV for 3D picture control, do we really need this for this kind of simulation that Thang wants to create?
Regards,
-
-
QUOTE (Thang Nguyen @ Oct 28 2008, 08:08 AM)
Hi,I am trying to simulate a vehicle moving on a map. In this project I use picture frame to draw the map and the vehicle. What I want is the position of the vehicle is updated and redrawn continuously without redrawing the whole map. Currently my vehicle is just a point. I would like to know if there is anyway I can erase the old point and draw a new point without redraw a whole picture? For furture extension, is there anyway I can do that with an object like a circle or a rectangle?
Thanks,
I normally use picture control, i quicky wrote an example to show you how to do this. Basically i have 2 picture controls in this example, 1 for the map and
1 for the object obviously. I loaded them when the program started, so only need to load 'em once. I use state machine with event design partern as the structure of my program. This example shows that you can move the object around the map by calculating the new Origin (x,y) - relative to the front panel,
and write to the Origin property node of the object.
It would me much better and easier if you use GOOP to design as you can classify all of your different objs and their properties: for example: object name, color, components, position, size, transparency level, etc...
If have time i recommend you to have a look at Endevo GOOP tool from Mikael, it's awsome.
Good luck
-
QUOTE (d_nikolaos @ Oct 27 2008, 09:52 PM)
external applications >>activeX>>Excel
Example from ni: http://zone.ni.com/devzone/cda/epd/p/id/3409
Good luck
-
what about this pic:
-
QUOTE (km4hr @ Oct 27 2008, 10:51 AM)
My first experience creating a subVI is failure http://forums.ni.com/t5/util/emoticonspopuppage' target="_blank"> . The first use of the subVI works fine. But when I create a second instance they interact with each other. They appear to share data somehow. That is, when I probe a wire inside one of the subVI instances I see values that should only be present in the other instance.
 I created the subvi in literally "textbook" fashion. Everything falls into place just like an example from the book "LabVIEW 8 Student Edition".
My code works fine when not used in a subVI. That is, when I "cut-and-paste" the code multiple times it works correctly. But when I encapsulate the code in a subVI I get interaction between instances. Has anyone else ever had this problem? What did you do about it?
can you post the vi(s) so i can understand your problem better?
-
QUOTE (d_nikolaos @ Oct 25 2008, 08:33 PM)
Hello,I have made two Vi's. The fisrt one saves some random numbers to .xls file and represent them
at the same time. The second one reads them.
My problem is that I read them but I can't represent them to a plot.
These are the two VI's
personally i dunt like lvm file, as you mentioned you want xls file it is better to use the 'write to spreedsheet file' and 'read from spreedsheet file'
functions under the file i/o within function palette.
Specify your file to save as *.xls, this will allow you to wire in 1D or 2D array of data. example as shown.
-
QUOTE (crelf @ Oct 24 2008, 09:31 AM)
Set the control/indicator to off, right click on it (from the front panel), and select Data Operations > Make Current Value Default.I agree, as beginer to Labview this method works best.
When HORATIUS finish reading and practising Intro To Labview in 6hrs or something similar then you can start looking at
Property node and Invoke node, execution order and data flow.
Enjoy LabVIEW HORATIUS !
-
As you mentioned that you are displaying 'live data' so ofcourse you have to place your
chart/graph inside the loop that way your data is updated every iteration of the loop.
You cant have it outside the loop as it will only update the data when the loop stoped.
-
QUOTE (Antoine Châlons @ Oct 22 2008, 08:15 AM)
-
QUOTE (tmunsell @ Oct 22 2008, 11:04 AM)
I've attached a screenshot of the final graph which is created in Excel after the test and printed for the customer. Is it possible to recreate this graph in Labview, with the limit lines, and live data showing up as a dot or a line while the engine is running? I already have the subVIs needed to get the live data from the DAQ. I just need to be able to add the "permanent" limit lines to the graph so we will know if it is falling within the limits.Thanks in advance!
Todd
Depend on how you are capturing the 'live data', if it returns in the form of array then the best is to use the build array option to create multiplots
to the GRAPH. If it returns in the form of point, we can using CHART (Use bundle node to create multiplots) like the example attached.
Good luck,
-
QUOTE (rccardude909 @ Oct 17 2008, 11:35 AM)
Hey MinhThanks a lot for the reply. I transferred my code to a PC version of labview and built the application from there. On the target computer I created a global virtual channel and installed the DAQmx drivers. The device shows up and is running. However I'm still experiencing the same error. Any insights as to what I'm doing wrong? Thanks again
any chance you can post a snapshot of the DAQmx devices in MAX (within the Target PC) and your code?
Just want to see the cofiguration and the consistantcy of the code/system.
-
-
QUOTE (aginor @ Oct 17 2008, 08:24 AM)
as you see in the image i am ploting the results of the sine derivetive in the "waveform chart" the chart shows the speed of the sine.know i am putting the amplitute of the sine in one "siftregister". If i subtract the two "siftregisters" i am finding the dx
the same procedure for the time too. with this i am finding the real dt. this is an example, my real VI is too big and some times i am out of time......
then i divide this 2 and i am making the dx/dt, the speed but not m/s!! it is m/100ms!!!. this is diferrent from the other derivatite.
for my aplication i need the speed. The average speed in m/s that "happens" between to circles!!!! how i can mesure it??
You have a timming Vi set to 100ms so you have m/100ms, if you set that to 1000ms then you have m/s.
The execution control timming of 100ms might not give you exactly 100ms everytime, this function depends on
alot of other factor from OS and other programs that run in the background. Hope you take this into account.
Have a look at the Mathematics>>Integration and Diff>>Derivative X(t) vi as well.
-
QUOTE (normandinf @ Oct 15 2008, 09:25 AM)
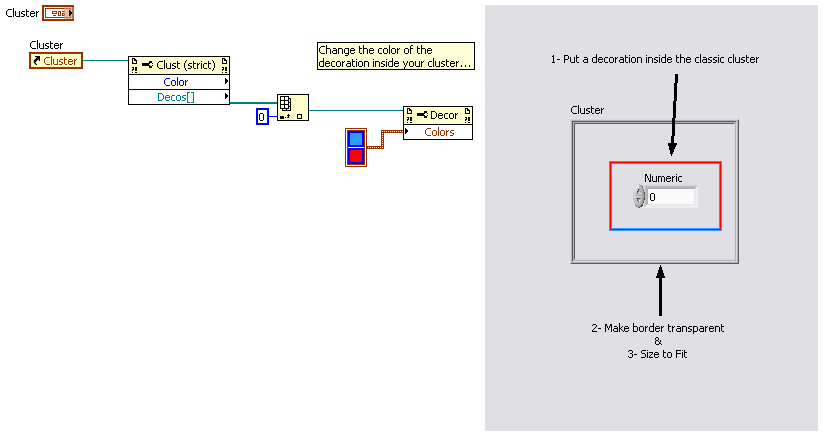
It's a pretty good trick, it works with array of cluster as well. However it requires abit of work on the decor size if the program allows user
to create their own data area (as decor doesnt have an auto fit option), but this isnt to hard to figure out. Thx.
-
I just wonder if anyone success in programatically change the frame/border color of the Classic Cluster control/indicator?
It doesnt look like this property existed, does it?
Thx
-
QUOTE (crelf @ Oct 13 2008, 10:49 AM)
You're going to have to give us a whole lot more info than that to get a useful answer. What are you looking at? Is it a physical object, or do you already have a digital image? What sort of color system are you looking for (RGB, YUV, Yu'v', HSL, wavelength, general name, etc)? Give us some more context and we might be able to be more helpful.Digital images? LabVIEW is the software :camera:
-
QUOTE (CArnold @ Oct 9 2008, 02:26 AM)
Thanks, I tried the help/explain error and am working through understanding it.Your VI looks pretty messy and follows no dataflow structure. It doesnt use modularity as well. I dont know how you going to
add functionalities nad features in the future.
As you have 2 For loops running in parallel at a certain point of your program, DAQ assistants are everywhere in the code. Durring this parallelism
process, there is a chance that 2 DAQ Assist will conflict each other.
I dont know how your HW suppose to work but if you can, make sure that one loop is run after another then the problem might be solved.
If you have to run the loops in parallel then make sure look at couple of tutorial on synchronisation and multiple loops design paterns within lapview help.
Regards,
-
-
I believe design something within your major / field is a good choice. (electrical, telecom, control, biomedical, mechanical, imaging, optics, automation....)
The best choice is something that you really interested in (something that you think is cool!)
I dont have any specific suggestion as you didnt describe much about you in your post.
Good luck,

How can I save the whole block diagramm as a picture?
in Development Environment (IDE)
Posted
QUOTE (horatius @ Nov 4 2008, 10:49 AM)
Vi Ref >> Invoke node >> Get Img Scaled
As shown: