

jim85
-
Posts
12 -
Joined
-
Last visited
Never
Content Type
Profiles
Forums
Downloads
Gallery
Posts posted by jim85
-
-
QUOTE (Mark Yedinak @ Feb 19 2009, 10:45 PM)
I agree. I am completely in the dark about what you are trying to do therefore I can't even begin to suggest a solution for you. With that said if you are trying to process your data in parallel you could use a queue or a notifier to pass the data from one task (the For loop) to another task (draw your graph). That essentially is the basic method for passing data out of a loop to be processed by another task.Basically, I’m using Agilent 8720 ES, S-parameters network analyser. I used this device to display the electromagnetic field effect graph. The graph is display on the analyser display; I have display the same graph on my VI. So, I’m using only one marker (which is the X-axis value or frequency) and take the amplitude reading (which is Y-axis value) around 10 values. I have to move that marker along the real graph on the analyser and take several maker reading (10 values). The marker values are the amplitude values(Y-axis values)on the graph.
The result is coming in an array format and I need break it out to get the values. For an example the frequency range is between 1GHZ to 10GHZ, and I want measure the amplitude for every 1GHZ gap (10 values). I have to manually increase the frequency by 1GHZ in the analyser and read the amplitude value from the analyser.
The problem is, the analyser gives the values for all those 10 measurement amplitude together by one array value. So I want break the array by using index array, after that I have break the each values into different pieces (Because in each of the 10 measurement result value from the analyser have 3 output values, but I’m only going to use 1st value only) and then convert into numbers and then again convert back to one dimension array as an y-axis input value for the graph.
Now I’m having the problem with the breaking array from the analyser by using index analyser. That’s why I used for loop to break the array one by one and use the value separately after that.
I have selected “Make current values default” for the main VI and attached the sub VI with this post. I’m using this sub VI from “McLennan Motion Control”. Do you know any other simple method to do this without using those sub VIs?
Can you please help me with this? Thank you very much for your help.
Regards
Jim
-
QUOTE (dblk22vball @ Feb 18 2009, 09:55 PM)
What are you trying to do with the "element" that you get from your array??You could just wire the array into the For loop, and then it would auto-index your array, displaying each element as it goes through the array.
By the way, your shift register is not doing anything, since the left hand terminal is not connected to anything.
Hi,
Thanks for your reply. I have designed a different VI now, but I can get the array elements inside the for loop only. I couldn’t get the array elements value outside the for loop, one by one when the for loop execute. Because I have received this array from the S-parameters network analyser, I want to use those values to plot an x-y graph. So I have to break the array elements separately to draw this graph. Do you have any idea to move the value outside the for loop or any other method to break this array?
I have attached the new VI with this post.
Regards
Jim
-
Hi guys,
I have designed a VI with the for loop, shift register and the local variable. I want to increase the index value by 1, when the for loop execute each time. But, I couldn’t change any value until the for loop execution is finished. Can anyone help me with this problem please? I have attached my VI with this post.
Regards
Jim
-
Hi Guys,
I have implemented the VI to read the data from the analyser. I want to save the reading data and retrieve the results together to draw the graph. I don’t know how to save the data on the VI and get all the results in a time. Can anyone help me with this please? I have attached my VI with this mail.
-
QUOTE (normandinf @ Feb 11 2009, 06:05 PM)
Hi Jim,you can download the driver from NI's site.
Your problem is likely a configuration issue. I have no personal experience with this equipment.
good luck.
PS: May I suggest you start a new thread if you want help with programming for a network analyzer?
Hi,
Thank you very much for your kind help. I have solved that problem with the drivers, you have send me.
Then I have a another problem with storing the data and retrive. As you said I have started a new thread and attached the link for you. If you have some idea about this, please let me know.
http://forums.lavag.org/Draw-a-graph-from-...lts-t13241.html
Regards
Jim
-
Hi Guys,
I have a problem with the drawing x and y axis graph from the Agilent 8720ES S-paramters network analyser marker results. The results are created by the analyser in a given time. I want those results to save in my VI and retrive together to draw a graph.
I dont know how to save it and take back the results together. Can anyone help me with this? I have attached my VI with this mail.
Regards
Jim
-
QUOTE (normandinf @ Feb 4 2009, 01:30 PM)
Hi,
Now I have updated my Labview version to 8.6. Thanks for you help.
And I have a another doubt. I'm trying to get marker reading from the Agilent 8720ES s-parameter network analyzer. I want to get serval reading to draw a graph through my vi. When i asked the analyser to send 2 data or 2 marker reading, i can able to read only the last value from my vi. I want serval reading to draw the graph.
How I can improve it take many readings? i have attached my vi with this mail.
Again, thanks for your help.
Regards
Jim
-
QUOTE (normandinf @ Jan 30 2009, 06:04 PM)
Hi,
Thanks a lot for your help. I have a problem with the opening your GPIB_call.vi, because your coding in LabView 8.6 version.But i'm using 8.5.1 and 8.0. Could you please able to send in one of my versions? It'll really great if you send it to me.
Regards
Jim
-
QUOTE (normandinf @ Jan 29 2009, 01:44 PM)
Hi Jim,GPIB is a communication bus, so the PM341 would need to have a IEEE488 connector and be able to interpret the syntax.
From the manual, PM341 uses RS-232 communication protocol. Now, while some instruments have the same command structure for GPIB and RS-232, this one doesn't. (Page 20 of the manual)
Hi,
Thanks for your kind reply.
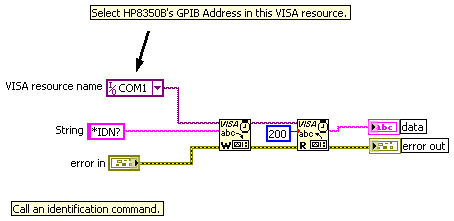
Actually I want to communicate with 2 device at the same time. With the PM341 through the RS232 cable and HP 8350B sweep oscillator through the GPIB cable connection. I have designed a very simple VI to communicate with this oscillator, but unfortunately my VI showed some error message called "error 30 occurred at GPIB initialization".
And it says possible reasons: LabView: Bad print records
NI-488:No GPIB address input.
I do not know how to sort out this problem. I'll attach my VI with this mail. Can you help me with this?
Regards
Jim
-
QUOTE (AnalogKid2DigitalMan @ Jan 28 2009, 06:51 PM)
Have you read the manual of the 341? If you did you would have realized that you cannot use GPIB.Yes, I read through the PM 341 handbook already. But I don’t understand, why you are saying that I cannot use GPIB to control the stepper motor?
Could you please explain for me?
Thank you very much for your kind reply.
Regards
Jim
-
Hi Guys,
I want to control a stepper motor through PM341 controller via GPIB cable. Is anyone have sample coding or tutorials, which is help me learn and design the VI??
Regards
jim
Move the value out of the for loop
in LabVIEW General
Posted
QUOTE (dblk22vball @ Feb 20 2009, 03:49 PM)
Ya, you are correct, but I want to do everything automatically and continually by the VI. So I need a loop to choose those string one by one and break into piece(Just want to use the 1st bit only, as the amplitude or y-axis points) and then want to convert into number, again convert to array element to draw the graph.
I'm having the problem with run everything automatically. So far I can save those strings in the shift register, but I want to build a loop to choose those strings one by one.
Do you have any idea about that?? Thanks for your reply.