

Sparkette
-
Posts
399 -
Joined
-
Last visited
-
Days Won
28
Content Type
Profiles
Forums
Downloads
Gallery
Posts posted by Sparkette
-
-
Thanks for the counter tip, I'll take a look at that when I get a chance. If that doesn't work, I'll just keep using the serial out on my Arduino.
Also, I looked up the myRIO, but on NI's website it doesn't even list the price, and says to contact my NI representative! Can't find one on eBay (where I got the myDAQ) either. But seriously, why wouldn't they list prices? If they did wouldn't they get more business, because it would be easier to buy it?
(Humorously, when I searched for "ni myrio" on eBay, it autocorrected to "ni mario"!)
-
You can't use the FPGA for your timing needs?
Don't have one.EDIT: In case anybody's interested, I actually ordered a RIO evaluation kit on eBay today. (Not for this though.) Just thought I'd update this post.
-
Now if only LabVIEW was open source...

-
 1
1
-
-
I always just keep them enabled. I don't have to worry about accidentally using one without realizing it's private, as the nodes will turn brown.
-
Disclaimer: This technique makes use of multiple private properties/methods (one of which is optional), as well as some private menu options accessible through the INI key "enableSecretPopups=True". I believe this use of them is safe (in fact I'm pretty sure RestrictLRGrowMove is being used for its specific intended purpose!) but as I don't work for NI, I can't make any guarantees.
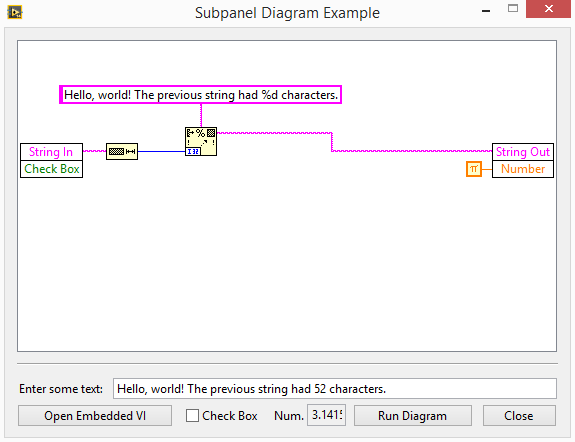
I know that many of LabVIEW's dialogs are implemented as VI's, and I was curious if the statechart module's state configuration dialog was implemented in this way as well. Sure enough, it was, which meant it was possible to create an editable block diagram as part of a VI's front panel. It didn't take long to figure out that the input/output nodes on the left and right were really unbundle/bundle by name nodes, as it was literally as easy as putting the mouse over one and looking at the context menu! I didn't at first know how it prevented them from moving left and right or being copied to another VI, however. I realized it had something to do with the object's flags through experimenting in Heap Peek. Then I found the private property called "RestrictLRGrowMove", which had this exact effect.
So yeah, this is basically just a VI I created as a demonstration of this technique. It's possible to put a block diagram in a subpanel through a scripting method, and it's also possible to enable editing in that subpanel through a private property or hidden menu item. Of course, the latter means this isn't officially supported by NI, but it's still an interesting technique. Perhaps someday it will have official support.
And if you're wondering why the unbundle/bundle nodes only show the text, it's actually very simple: there is no way to scroll in the subpanel unless scroll bars are enabled, and the rest of it is simply out of the viewable portion! The subVI that generates the embedded VI is kind of messy, but I put a step-by-step explanation of how it's generated on its block diagram as well for that reason.
-
I want to use a MyDAQ to communicate with a serial LCD I got at RadioShack. However, it is my understanding that the MyDAQ doesn't have built-in hardware timing for digital I/O. I know I could use one of the analog outputs as a digital line, but I'd rather use an actual digital output if possible.
My computer has a 6-core processor, so I was wondering if maybe I could use one of those processor cores for the same purpose one would use a real-time OS. Is there any way I could install something that would run at kernel level and make Windows temporarily behave as if there were only five cores, giving my VI exclusive control of the remaining core to use for timing? (or would other USB devices, or the USB controller itself, add too much latency?)
Or is there some other way I haven't thought of to output a 9600-baud serial output from a MyDAQ digital line?EDIT: Thank you, whichever moderator clarified the title for me as I requested!
-
Here's some more that may or may not have been in the initial Pastebin dump, found by doing random things in LabVIEW with the script running. Are any of these what you were talking about, Aristos? None of them seem too secret (with the exception of the misspelled "PaletteHidden..." ones, which are actually just lists of categories to hide), but you never know.
AssistantsUseStrictTypes
autoerr
autoToolOn
cacheAlignmentComplexityLimit
cacheAlignmentStrategy
cacheAlignmentUseReadsAndWrites
CaseDiagramInplaceSharingEnable
CloseHeapsAfterVISignatureCalc
customizeFPPopupMenus
DeepestAllowableRecursion
defPrecision
EditEventsDlgSize
EnableExternalDataValueReference
EnableRegisterCandidateDebugging
EnableRegisterCandidateLoopIndex
EnableSyntaxCheckrogressOutput
fadeEphemeralWires
failAutoRouter
FindVIsOnDiskLastDir
FindVIsOnDiskPosition
GarbageCollectionAtVIClose
grayOutMethod
GSW_filter
GSW_Pinned_Files
GSW_Pinned_Templates
GSW_Pinned_Templates_names
GSW_RSSCheckEnabled
hideBDPopupMenus
hideEmptySubPalettes
LaunchTimeBenchmarking
leftClickPopupPalette
loadAlwaysSearches
LocalHost
LVContextBannerPopUp
LVLibraryThemeColor
menu.4
NavigationWindowScrollInterval
NewDlgBounds
NewDlgCollapsed
NewDlgLastSelected
NewDlgRecentMainTemplates.pathList
NewDlgRecentTemplates.pathList
NewProj.maxNum
NewProj.RecentLocationPaths
NewProj.RecentTitles
NI_GSWPosition
NoAdvice070
NoAdvice080
OverrideDisabledCLFNs
PaletteHidddenControlCategories_LocalHost
PaletteHidddenFunctionlCategories_LocalHost
PalMenuResized.1
PalMenuResized.2
PalMenuResized.3
ProbeDefaultCache_14_0
ProbeIniCache_14_0
project.BuildsViewActive
project.DependenciesViewActive
ProjectExplorer.ClassicPosition
ProjectExplorer.ProjectItemsColWidth
ProjectWindowCanSave
PropPageBounds
propPageDebug
recentUserName
RegExpMatchLimit
resettingDlgDelay
SaveChanges_ApplyToAll
SaveChangesAutoSelection
SaveChanges_ExpandedAffectedFileList
saveFloaterLocations
ScaledToFitLocation
ScaledToFitWindowState
SCCDisplayOnlySelected
SCCDisplayWarningIfCheckedOut
SCCIncludeInstrLibInGetDependents
SCCIncludeVILibInGetDependents
SCCPromptToAddToAddSubVIs
SCCPromptToAddToProject
SCCPromptToCheckOut
SCCSelectCallersWhenCheckedOut
SCCSelectHierarchyWhenAdd
SCCUseDialogBox
serviceLocatorTimeout
showAllPalettes
ShowDeferDecisionDialog
ShowRemoteWindowsTargetWebDocRoot
ShowRTTargetWebDocRoot
showRunAtAnyLoopMenuItem
ShowWelcomeOnLaunch
ShowWireAddressMode
SnapGridShowsOnBlockDiagram
SnapGridShowsOnFrontPanel
SnapGridSnapsOnBlockDiagram
SnapGridSnapsOnFrontPanel
tileUpDown
ToolbarState
UnitDialogGroups
VISignature.ActiveDiagOnly
VISignature.SkipCPTM
VISignature.SkipFPDCO
VISignature.SkipLinkRefs
-
I don't see what's wrong with the term "subVI". Yeah, any VI can be used in another VI as a subVI, but once that happens, it's no longer a top-level VI, so the term will apply.
-
Mwuhahahahaha! Three config tokens have escaped your grasp! I modified them specifically for folks like Flarn! They don't appear as plain text anywhere in the EXE (or in any VI for that matter). Do they guard any great secret of LabVIEW? I'm not telling! But you can have fun pouring through the code and looking for interesting bits and trying to figure out what you need to put in your config file. LabVIEW 2013 or later. Good luck.
If they are read by the same internal "CfgGetDefault" function, my script can find them. The only way they wouldn't be in that Pastebin dump I linked is if they are read by a different function or if they aren't read as soon as LabVIEW opens. If the former case, it'll take more work. If the latter, it's just a matter of running LabVIEW through Cheat Engine (with the Lua script running) and trying different things until it checks for that token.
But I accept your challenge, provided you're not just trolling.

-
Well almost two years later and guess what, I have found how to replicate this functionality, and abuse it to my liking. I just submitted a code repository for a Variant Repository which is basically reading and writing variant attributes with some added functionality. The read function has the ability to look at the data type that the output is wired to, and change the type to that.
Doing this was relatively easy using XNodes and the Adapt To Inputs ability. It gets the reference to the output terminal, then gets the reference to the sink location of the wired tied to it, then gets the data type of that terminal. It will default to a Variant if it has issues in this operation. The performance of using this is basically nothing because all it does in my case, is change the type of a constant on the block diagram of my XNode.
Did you mean to add "penalty" or something there?
Also, I decided to give this a try myself. Here's an XNode I made that's basically the type cast function, only it implements the behavior described in the thread. (I actually got the idea to do this in an XNode before I noticed hooovahh's post; maybe he hadn't posted it yet.) A couple warnings though: one, I haven't tested it that much, and two, it uses a private method in the GenerateCode ability to create a constant of a given type. No idea why this method is private; I don't see any problems using it can cause, but I'm warning you because I imagine it's marked private for a reason.
Also, if you right-click it, there's an option to replace it with a regular typecast node along with a constant of the proper type.
-
1
-
-
Okay, thank you!
Actually, come to think of it, how were those decorations initially placed on the Silver controls? The ones that aren't in the palette, I mean.
-
It works with a void array constant as well, not just Initialize Array.
-
Easy to reproduce; just follow these steps:
- Place an Initialize Array node in the block diagram
- Make it a large number of dimensions (really anything more than 1 will work, but do more for full effect)
- Do not connect anything to the Initialize Array, so it remains void
- Right-click the output terminal, and go to Create->Indicator
- Look at the index displays on the front panel.
When the array indicator is created, it's supposed to set aside memory to store the selected indices for however many dimensions are needed. But apparently, if the type is void, it only sets aside room for one dimension, leaving the additional index displays pointing to addresses that are supposed to be used for other things. I searched for the values that appeared using Cheat Engine, and sure enough, it cuts into a section of memory that looks like it's being used for something else.
On a side note, just for fun I changed the values on all the index displays, and one of the index displays changed to show garbage characters. Then when I closed the VI, LabVIEW crashed. So yeah, it looks like a buffer overflow.
This is in 2014 btw.
-
1
-
Good advice for future reference. I didn't know that was possible. But he has helped me out before.Hmm, you really just double clicked them??? With Vis from unknown source this is not very smart. You should always create an empty new VI and place an unknown VI on the diagram and then open it from there. These VIs are set to autostart when loaded as top level VI, and tinkered with so you can't set them to edit mode. If they contained bad code in the diagram, you would be hosed now!
I went through Ctrl+Shift+D Ctrl+Shift+<another key> for all keys on the keyboard to see what other things come up. I never found the _ debug because I was expecting some kind of popup like the W and H return.
EDIT: It looks like the wireframe drawing work on 2011 not sure about older.
-
Oh in that case I would guess it's okay. I didn't pick up on that part. Though there's still no guarantees. And you wouldn't want to use one like Genericity.
-
That's weird; that first VI you posted closes as soon as I open it. And the second one points to a directory that doesn't exist.
-
Thanks! I thought that one might have had its functionality removed, since "MathScriptFastPropTypes" is mapped to the same memory address, which is kind of strange. I'll add it to the list at the top. Do you happen to know off hand what other menu items it enables?
Oh, another thing: that PDF you linked to mention some new decorations that aren't in the palette. If they're not in the palette, how do you place them? (I also know there are other decorations that aren't in the palette, that I've found by manually editing the image ID of an object in memory (thanks, whoever made Heap Peek show memory addresses); is there a special palette with all the images hidden somewhere?)I think there's actually more that just aren't loaded until they're needed. But there is a way to monitor every config token LabVIEW looks for. Download and install Cheat Engine (pay attention when installing it, as it may ask you to install "sponsored" stuff as well; CE itself is open-source and safe to use though.) Run the program and click the Memory View button without targeting any process. In the new window that appears, press Ctrl+L, or go to Tools->Lua Engine. In the box at the bottom of that window, paste in the following script, making sure to enter the path to LabVIEW.exe in the marked area, replacing every \ with \\:
LVEXEPath = "PUT PATH HERE"

createProcess(LVEXEPath, "", true)
CfgGetDefault = getAddress("LabVIEW.CfgGetDefault")
debug_setBreakpoint(CfgGetDefault)

function debugger_onBreakpoint()
    if EIP == CfgGetDefault then
        local a, b, c, d = readBytes(ESP+4, 4, false)
        local size = readBytes(readInteger(ESP+8), 1, false)
        local str = readString(readInteger(ESP+8) + 1, size)
        local addr = readInteger(ESP+12)
        print(string.format("%s (0x%X) [%c%c%c%c]", str, addr, a, b, c, d))
    end
    debug_continueFromBreakpoint(co_run)
    return 1
end
Finally, make sure LabVIEW is not running, and press Execute. LabVIEW will open, and Cheat Engine will list every INI token as LabVIEW looks for them. This is how I found the tokens I mentioned in the post at the beginning.
-
1
-
-
- Popular Post
- Popular Post
After digging around some more I found more hidden INI keys. Again, use these at your own risk.
- whileLoopSharedCloneOptions=True - adds an additional context menu option to the While loop; not sure what the different options do
- GenericsAreGo=True - enables the creation of generic VI's (danger!) by right-clicking a control or indicator and selecting "Generic"
- ActiveXMoreContainerOptions=True - Adds "Persist State To Edit Mode" and "Destroy And Recreate When Run" to the Advanced submenu of an ActiveX container
- AdvancedPlotLegendMenu=True - Adds a whole bunch of additional options to the context menu for a plot legend
- EnableStrictTypedefConstantConfiguration=True - Adds a new context menu item to constants based on strict typedefs called Act as Strict Typedef Constant. Function unknown.
- enableSecretPopups=True - Adds additional context menu items to custom control parts that configure how they scale with the control. Apparently some other hidden menu items are added somewhere too. (Thanks, hooovahh and Christina Rogers!)
- showRunAtAnyLoopMenuItem=True - Adds a new menu item to Property and Invoke nodes labeled "Run At Any Loop". When selected, the node turns brown as if a private property or method was selected, even if none are. Function unknown.
- ShowWireAddressMode=True - Adds some additional memory-related information to the context help window when you hover over a wire. Also adds a context menu item to wires called Select InPlace Signals, which likely selects wires that share a memory address. Seems like it could actually be pretty useful for optimization!
- SimShowCompanionDiag=True - Adds a context menu option to the Simulation structure called "Show Companion Diagram", which toggles showing what looks like a "behind-the-scenes" block diagram for the simulation.
- NEW! ShowHiddenLibraryItems=True - Shows hidden library items. (big surprise there!) So far I've only seen changes when editing a statechart library, but it seems most of the items in a statechart library are hidden, so it reveals a lot.
There's also some more whose functions I'm not sure of (but look interesting) such as TotallySecretAndPrivateMSNCompanionDiagram, and growSubVI.enabled (might be pretty mundane, but it's false by default and might have something to do with creating subVI's that can grow like XNodes.)
If I find any more interesting ones I'll post them here, but here's a list of every INI key loaded when LabVIEW starts, obtained by hooking the internal function that reads them: http://pastebin.com/j1iAEZXg. See here for information on finding the rest.
In the meantime, if anyone knows what any of these do, please post!
-
4
-
Okay, bumping an old thread here. For anyone who's still interested, I've discovered with almost complete certainty what Darren meant by "a certain way we can configure the UI to make controls generic." Simply add the following line to LabVIEW.ini:
GenericsAreGo=True
Now every control will have a "Generic" context menu item that does what you'd expect. I'll post this on the LabVIEW wiki as well. -
Why is it posted in OpenG? (Also, if any moderators see this, please don't remove this thread. Lock it at most.)
-
We've been asking for years to be able to create native controls (and create them dynamically). We got X-controls instead. Whilst the models define the art, there is no way to define the behavior which is hard coded in the LabVIEW exe.
Apart from the models that you have found, there is also the ability to load plug-in controls as DLLs. It is undocumented but one of the well known labview controls uses this method so you may have more luck with that (I'll let you find it
 ) as at least in theory you should be able to define behaviour.
Where can I find more information about this DLL feature?
-
Okay, I think I figured something out. The first eight bytes are 32-bit integers. I'm pretty sure the first corresponds to the number of "parts" the model has, but the second I'm unsure of. After that are coordinates of points as single-precision (32-bit) floats, in the order X, Y, Z, X, Y, Z, …. The aforementioned "parts" mentioned before are separated by "FF FF FF FF". As for what determines which points are connected to which, I'm not sure. That would likely use integer values, but there aren't any non-float values other than those two integers at the beginning and the FFFFFFFF that separates each part. I don't think the order in which the points are listed affects it.
However, the apparent lack of any information related to which vertices are connected made the term "point cloud" come to mind. And then I realized: perhaps that's what PTC stands for.
One more thing: it seems the models' filenames are hard-coded into LabVIEW.exe. Which means it wouldn't be surprising if it can't load model files that it's not already programmed to load. However, I did find this humorous string, presumably used for debugging: "This model doesn't know how to see it's [sic] shadow. Two more weeks of winter."
But seriously, LabVIEW's support for custom control graphics is just terrible. It's almost a joke: the only supported formats in which you can load in images (as opposed to only being able to use specific hard-coded images built in to LabVIEW) are all non-scalable raster formats. There is one exception, but that exception is Windows metafiles, and that format just sucks. And if they're going to program in 3D support, why not enable importing of models as well?
EDIT: Apparently it also supports PICT images, which also support vector graphics. But that's yet another obsolete format that nobody uses. And some format with a ".aaa" extension, which I know nothing about. I only suspect that because ".pct" and ".aaa" are found as strings near ".wmf" in LabVIEW.exe.
-
1
-
-
Hi all,
I just wanted to let you know the solution to my problem is no blocker anymore as I found a workaround. I can now simulate the environment for GenerateCode and thus find out which wires need to be broken right in AdaptToInputs. This information is then saved into the State and used in GetTerms4. So there is no need to have GenerateCode reply with "UpdateTerms".
The key to this simulation is the (private) method "Create Constant" of the "TopLevelDiagram" class. It is used to create constants of the same datatypes as the wires connected to the XNode.
It might still be interesting if there are other limitations as to what ability can answer what reply.
Regards,
Sebastian
Uh oh, looks like somebody's using a private method in production code.

In all seriousness, that one seems innocent enough, but the truth is you never know; it's probably marked private for a reason.
-
I've been hitting ctrl-u in these forums all month.
So have I! It's addicting!
-
1
-
I found some more hidden INI keys
in LabVIEW General
Posted · Edited by flarn2006
For anyone watching this thread, I've found another one's purpose. (ShowHiddenLibraryItems.) Unfortunately I don't think it's one of those super-secret ones AQ was talking about, as IIRC it gets checked on startup. But hopefully I'll find those soon!
I've added this to the OP, but it basically shows a bunch of extra stuff when editing statechart libraries.