

xShadowDanx
-
Posts
20 -
Joined
-
Last visited
Never
Content Type
Profiles
Forums
Downloads
Gallery
Posts posted by xShadowDanx
-
-
Hmm, i tried creating the period control using the Wait vi but still nothing happen. In fact now the Start Button auto run by itself without me even pressing on it.. do i need to put a loop too?
-
I ask about the question in the earlier post is a vi that takes a fixed period of temperature measurement ..
How can i actually take the measurement accordingly to the period adjustment? For eg. I create 1 more control which is the period(seconds)..and then i want to save the measurement accordingly to how many seconds i want and then it will automatically save. Can it work if i do that?
-
Hi fellow Labviewers,
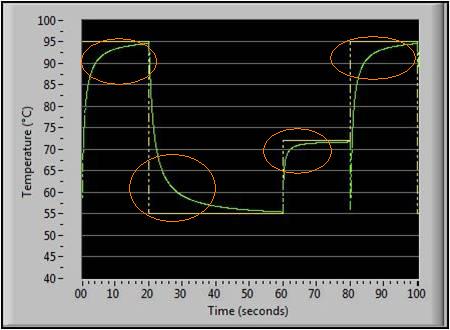
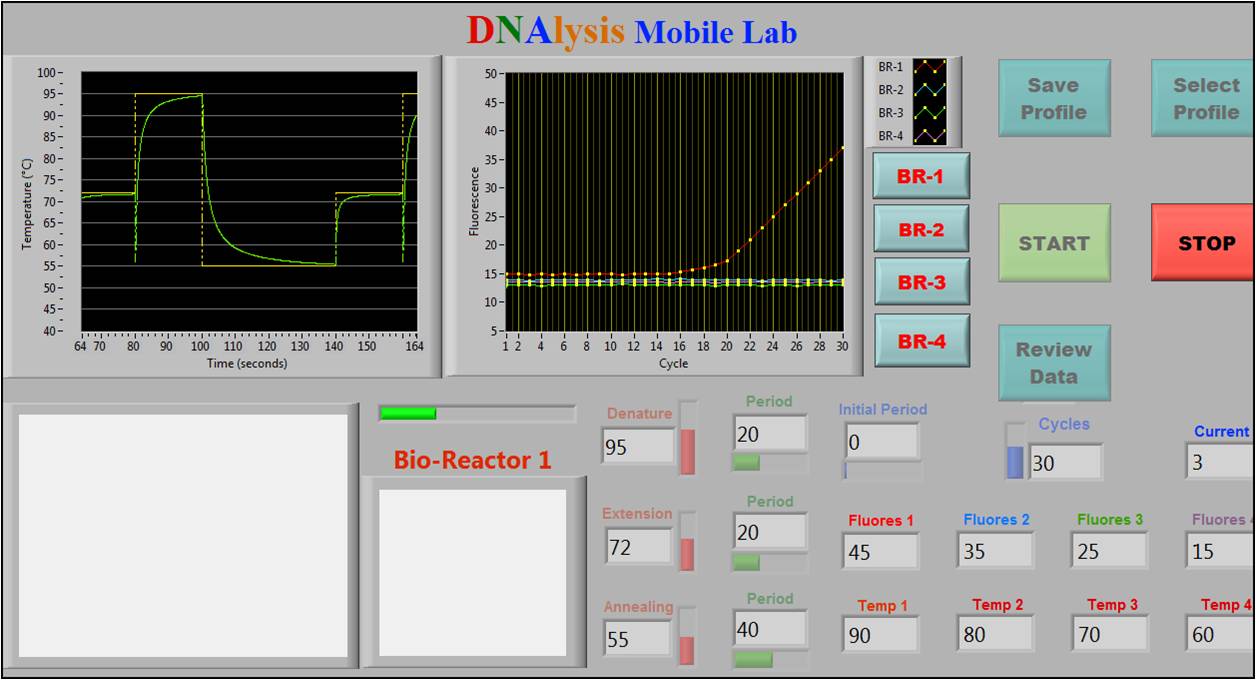
I'm a new LabVIEW 7.1 user. I've created a temperature graph and... now i need to create a curve that only shows when its rising and falling.. this is the picture to show what i'm asking for..

basically to do that, i need a formula node and a bit of maths expression but i just can't find any good formula to make that curve or its not that what i want(more "curvey" pls) Here's the attach vi..
Download File:post-15220-1241745007.vi ( Pls don't mind the straight line at 90 degrees on the graph, it wasn't suppose to be there >.< )
Can anyone help me out with this? Thanks..
-
ah thanks a lot for the upload
-
Sorry but i cant directly upload it here. Its together with other filess so i need to compile it and upload but... Lava just wont let me do so.
Aight, i've uploaded the files on other file sharing site.. the download link below works.
-
Aight, this is the whole code. Its big so i upload it to another sharing file site.
-
QUOTE (Ic3Knight @ Apr 27 2009, 09:49 PM)
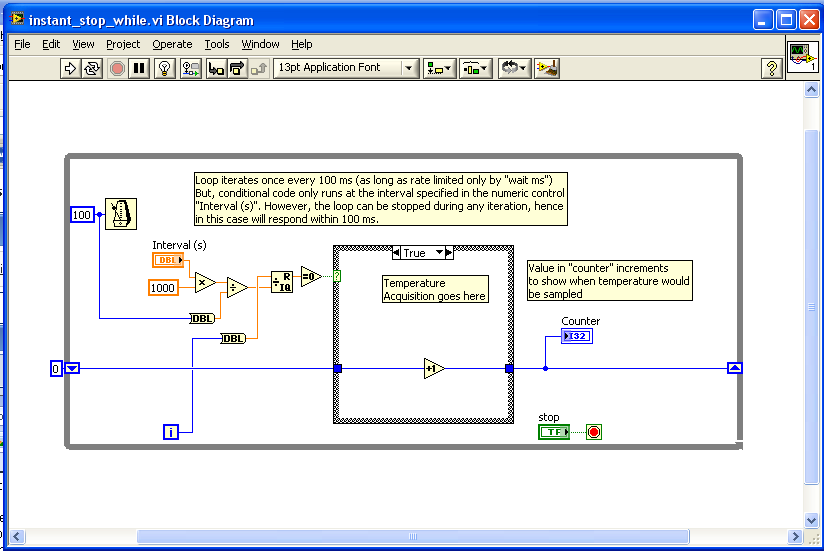
Not sure I entirely agree with Antoine's solution... Although I can see where he's coming from...However, another reason that there's a delay, is that you can't interrupt the "wait ms" VI. Pressing the stop control simply instructs labview to stop the loop at the end of the current iteration. So when you press it, it still has to do the waiting for the current iteration to finish. So, basically, there will pretty much always be some delay between pressing the stop button and the code actually stopping - its just more noticable in code where you have a time delay within the while loop.

Download File:post-14639-1240840128.vi
Hope that helps...
Paul
i got try your method but i just want to ask, wat is the interval for? Is it for the whole while loop or for my temperature acquisition plus when i put in my temperature acquisition inside the case structure its in stacked squence with for loop, but when i run it, it can stop but the graph show no data in it. so what wrong?
QUOTE (Antoine Châlons @ Apr 28 2009, 02:49 PM)
http://lavag.org/old_files/monthly_04_2009/post-15220-1240903582.jpg' target="_blank">
here the code i am currently doing..it run perfectly but when press stop it will run for a period of time then it stop. i was wondering if don't use for loop can use other method.
-
Hi, Can anyone convert this attach file to ver 7.1 ?
I don't have the updated version of Labview 8.6 and I'm using 7.1.1 . . greatly appreciated if someone can help.
-
Yep.. i tried Charlon's method and theres still a bit delay b4 it stop. I don't know which area I should change but now im trying the other solutions. Thanks guys, really appreciated the replies.
-
but.... i cant send it tru here.. cant upload the file!
-
Oh.. thanks a lot. I'll modified it now.. hopefully it works. =D
-
-
Im doing this Temperature Graph using a For Loop.. It works.. The graph shows the wave signal accordingly however when i press the Stop Button on the user interface(the control).. it refuses to stop immediatly, instead, it stop after a few seconds which i think after 1 cycle.
So it there a way that i can add on the block diagram to make it stop immediatly? I would gladly appreciate if someone can help me out with this.
- I cant upload the .Vi since there is a technical problem on my upload.
-
-
Download File:post-15220-1240543404.vi
I got a vi that takes a temperature measurement once every second until i stop the vi.
but instead of taking the measurement once every second, how can i change the code so that it take the measurement every 5 seconds ?
my version- 7.1.1 (thanks in advance)
-
QUOTE (Anders Björk @ Apr 1 2009, 03:58 AM)
Make a new VI. This time focus only get the signal from the temperature measurements. When you have solved that you write a VI for the cooling and heating outsignal. Then you read up on PID-controllers. Then think how make the first bit finnished.ouhk.. i'll do that.
-
I already did.. 2 good books in fact but in the end im stil clueless xD well thanks for ur time..appreciate it
-
QUOTE (Anders Björk @ Mar 31 2009, 04:07 PM)
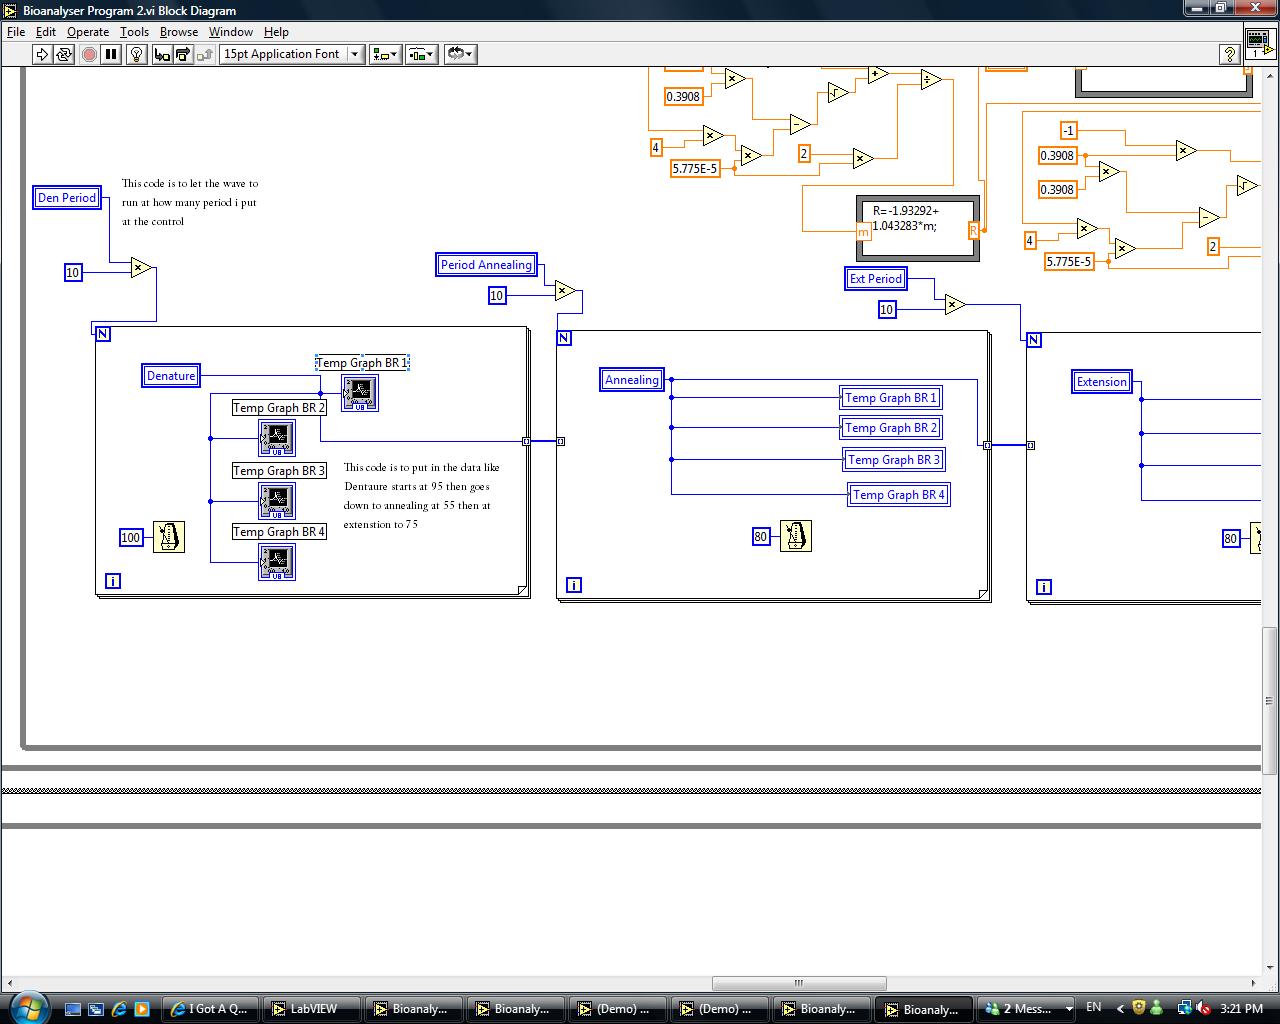
Where is your specification of the task? The subproblems that needs to be solved which are those?My task is to make the signal at the Temperature Graph to follow accordingly to the control..basically the control is the denature,extension,annealing and the period. The problem is i do not know exactly how to do that.
I need to find a solution as when the program runs, the graph suppose to increase and decrease for certain period by using the control.
The operation is in the picture that i had uploaded earlier.
It goes from 95 degrees celcius(denature) for 20 sec(period), then it goes down to 55 degrees(annealing) for 40 sec, then extend to 72 degrees(extension) for 20 sec and go back to 95 degrees.
Thanks for your time.
-
Hi, im given a project by my supervisor in school and i need to make a temperature graph that correspond to my control which is the Denature,Extension,Anealing and the Period(the rest dun really nid to care). I already done the front panel but i got no idea how to do the block diagram. Sorry if the whole thing looks messy. I really appreciate if anyone could tell help me out.. Thanks. Im using LabVIEW ver 7.1
(only the temperature graph and the control Denature,Extension,Anealing and Period)
(this is how it will move from left to right)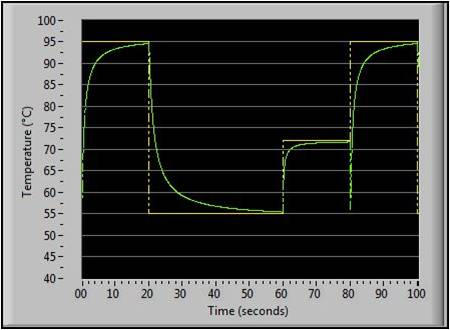

Temperature CURVE CURVE
in LabVIEW General
Posted
Boo hoo hoo.. anyone can help me po?