martin_g
-
Posts
29 -
Joined
-
Last visited
Content Type
Profiles
Forums
Downloads
Gallery
Everything posted by martin_g
-
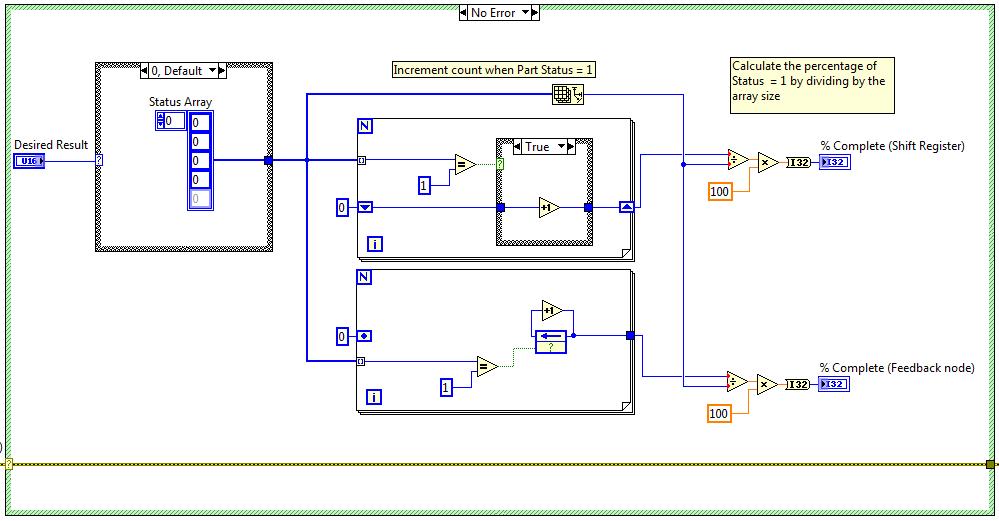
Hi All, After struggling on my recent CLD-R with feedback nodes, I've decided to try using them in some projects. I've got stuck on my first trial however! I've tried replacing a fairly common conditional incremental count within a For Loop, that I would usually do with a shift register, but I just can't get the correct result with a Feedback Node. Code is attached, is this a correct usage case for a Feedback node? In the current configuration, when count value returned from the Shift Register is zero, the count returned from the same code using a Feedback node is 1. I've tried other configurations, but still get incorrect results. Feedback Nodes.vi

-
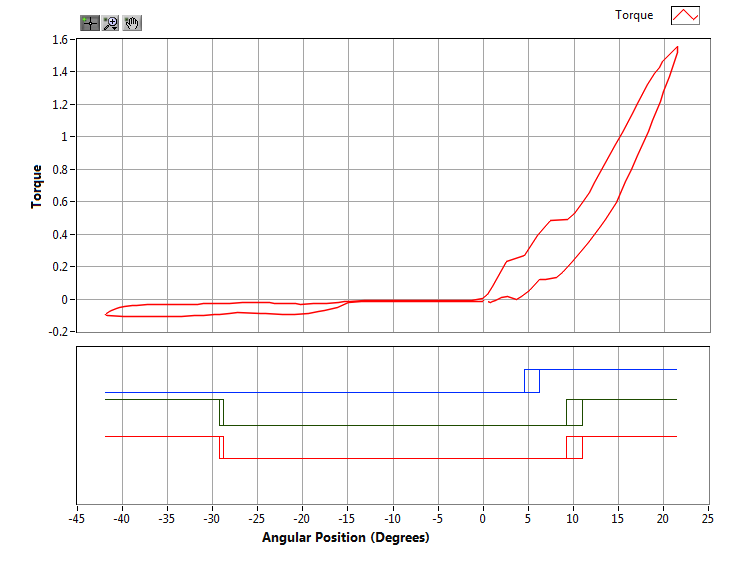
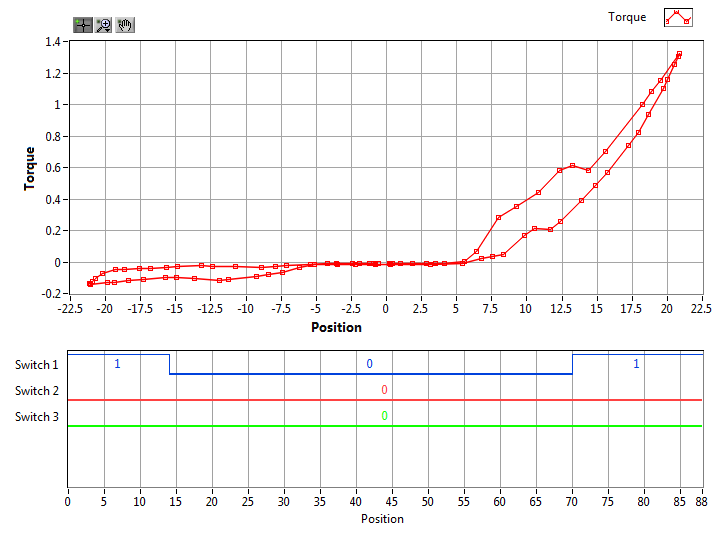
So I went with an XY graph, formatted the digital waveform data into numeric, with each plot set to a different scale, to separate the digital signals. Thanks! Martin
-
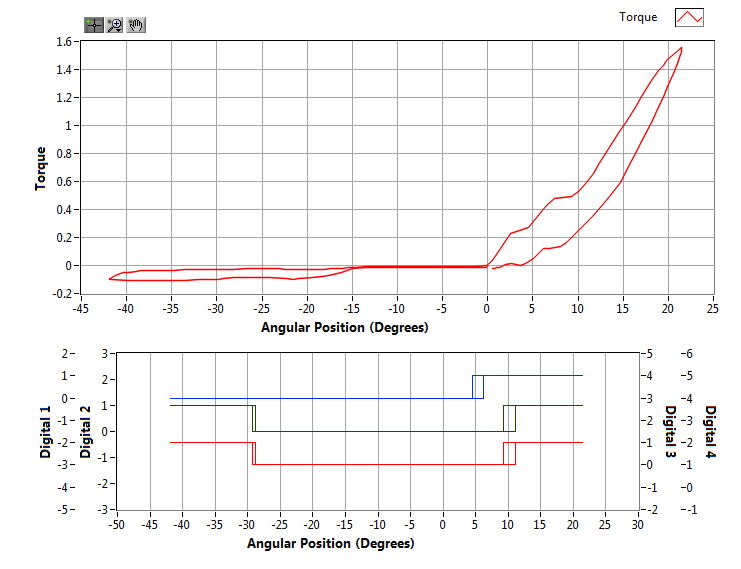
Hi All, I have an application that is tracing the mechanical and electrical parameters of a vehicle window switch. We move the switch by rotating a cam x degrees one, then back the other way, a common motion range would be +/- 20 degrees. We're monitoring angular position, torque and electrical contacts. I'd like to then plot a trace of torque vs angular position, to show where the detents in the switch are. I'd also like to use a digital waveform plot to show the state of the switch vs angular position (see attached image). I can't figure out though how to display the digital data against a DBL value, it seems to me I can't use a digital waveform display, because I'd have to plot against either time, or a U32 integer. I could use an XY graph, but I like the digital waveform feature of stacked plots for each waveform. Any ideas how I could do this? Thanks, Martin
-
Hi, Analog Devices produce a signal conditioning amp for J & K type thermocouples - AD594 I think. You give a DC supply voltage and get a linear voltage out, it also does cold junction compensation, and costs about $10. Used them lots of times with basic USB Daq cards, they are great. Martin