

wallage
-
Posts
23 -
Joined
-
Last visited
Content Type
Profiles
Forums
Downloads
Gallery
Posts posted by wallage
-
-
I have a PXI setup with a PXIe-4081 DMM in it.
I am trying to capture a current waveform, at 25kHz.
For some reason the first 8 seconds of the data capture seem to float, after which the signal stabilizes.Does anyone know the cause, and solution for this problem?
below is a snapshot of the data.
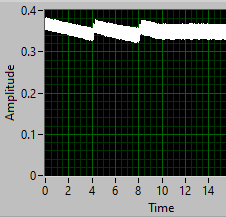
The DMM is connected in series with a LED load, which is connected to a DUT.
-
Hi all,
I have a problem debugging applications executables on a remote desktop.
I have created a very simple vi to test the issue.
It contains only a while which generated random numbers every 100ms.
The vi is created in LV2013 and the development machine is running windows 7
I have generated an installer the includes the necessary runtime.
For the executable the ´enable debug´ is on.
The remote machine in running windows xp sp3.
I have checked and can confirm that the NI service locator is running.
Also I have manually added port tcp 3580.
When I first executed the .exe I got the popup to unblock the application in the firewall.
I choose the unblock option.
However after all these things I still get the error `failed to start debug server´ on the remote machine.
Does anyone know a solution to the problem.
many thanks.
-
One step further would be to take a approanch like hooovahh's and wrap it into an XControl implementation - this is what I thought of when François hinted at 'more complex code'.
Thanks for all you replies.
I have not experience with XControl implementations what does it mean?
Another method is you can overlay a boolean array (flat square classic buttons work best) where the booleans are transparent except for the true state border colour. Then you just use the number to boolean array primitive to set one or more booleans "True" for the value or values you want to highlight in the main array. This will create a border around the value. But if you move it behind your array and make your array transparent, you can also make the boolean array "True" state bg coloured and it will look like you changed the background.
Thank you very much. I think I'll go for this approach.
I tried this with a color box array but with the classic boolean control it looks much nicer.
-
I have made a frontpanel with 2 numeric arrays.
I want to loop through these arrays and have two indicators to show the current element values but also use the loop counter to highlight the current element being processed.
I can't figure out how to highlight (use different background color) an individual array element.
NI says it is not possible but there must be a way to do this right?
Ooh sorry forgot to mention that I'm using LV8.6.1
-
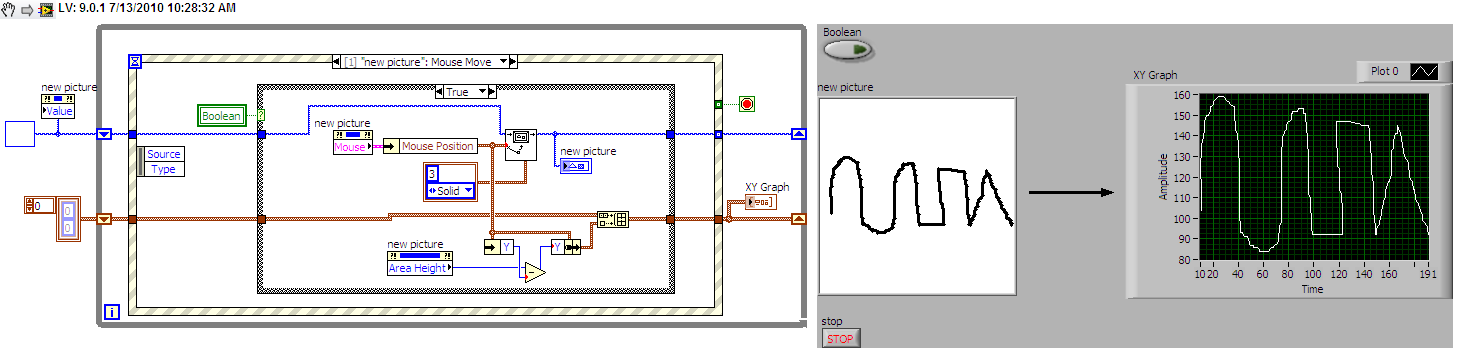
but you'll see that it doesn't faithfully represent what's been drawn. This is where you'll have to define how to convert X-Y data into a waveform (axis scaling and handling right-to-left pen movement, to start). Do you understand what I mean?
Thanks again for you reaction.
I have been tuning my software and also added code to scale/sort x- and y-axis.
My waveform is now almost a duplicate of the drawing.
There is however a bug which I haven't found jet which screws up my x-axis scaling.
I'll try to fix this myself. Thanks for all the help so far.
-
 1
1
-
-
It's possible, but you'd have to validate the drawing's data before you could make it into a waveform. I've made it into an X-Y Graph by doing this:
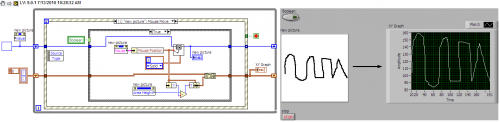
What would your waveform look like if you moved your pen from right-to-left? That's one thing you'd need to handle.
Interesting question, however. What's your application going to do?
main.vi (LV 8.2)
thanks for you reply.
I want to make a program where you can draw a waveform which can be later on be generated by my DAQ analog out.
-
Hello,
I have a pretty simple program with a picture control on the front-panel on which I want to be able to draw a wave.
I already came this far
 .
.Next I want to have some kind of function which uses the picture and generates a waveform which can be generated by the DAQ hardware.
Does anyone know if this is possible and how?
attached is what I came up with this far.
-
I see.
Just another thought:
You mentioned, that you are getting data from 21 different channels. Is it neccessary to have the data off all channels (and measurement) within a single 3d plot? Or is it ok to have only the FFTs of one channel in one 3d plot and then have the ability of scrolling through the different channels. Maybe have an additional 3d plot for a second channel for data comparison?
In that case you can reduce the needed memory by factor 21 or at least 10.5. And scrolling through the channels should be not too boring. The FFTs are calculated real fast. 20k FFT with each having 1024 data points takes less than 3 sec on my machine. Consider to use 2^n data points to use the FFT algorithm instead of DFT. That should be faster if I am correct. (Edit: ok, you need some extra time for loading the raw data for the selected channels. Maybe you can organize the data files per channel to get faster or easier access to the channel data.)
Regards,
Frank
I have looked some more at the data that I want to process and I found that I only need the raw data of 1 analog channel for the FFT and that would be the one from the light intensity sensor.
The other channels measure current and voltage and I can "mean" the 1000 sample per channel resulting in a dramatic decrease in data.
I still have to work everything out but I think that I'll be able to work around the memory issue this way.
Thanks for all the help so far.
-
This happens on my machine too. Off course you have more memory available than just 160MB and I don't know the correct reason why LV claims so early that the memory is full. Afaik the amount of memory you can use in your VI is depending on your hardware (physical memory and so on) but I'm not sure how it is calculated.
But I still wonder why you want to collect this huge amount of data in memory. Your single measurement shots are small enough to have no negative effects to the memory usage. Simply stream the data to a file after each light measurement of a single setpoint.
Or are there any needs that you have to collect all the measurements in raw value in your memory?
Regards,
Frank
Hi Frank,
After having acquired all measurements I need to make a 3d plot with:
x-axis = dim setpoint
y-axis = frequency
z=axis = FFTvalue
to make this plot I need all the data (right?).
I can calculate the FFT plot for every "dim setpoint" separately but in the end I still have all data in memory because I need it for my 3d plot.
-
Hi all,
Many thanks for all your input so far.
I have simplified the "write binary" case a little bit and still I get a memory full error.
I don't understand it because in the current situation the VI only uses 160MByte.
2D array of DBL's (64bit) size 10x1000 = 640Kbit
This multiplied by 2000 for the 3D array after the for loop makes: 1280Mbit or 160Mbyte.
I can't imagine that this will already generate a memory full error.
Could there be another reason?
-
Depending on your time/budget constrains it may be sufficient to max out your computers memory (4GB), and eliminate unnecessary programs from running. (How much memory are you running right now?)
Either that, or upgrade to a 64bit machine with 8GB or more of memory (you would have to use a 64bit version of LabVIEW).
However, there really should be a way to overcome your problems without throwing hardware at it.
I have 2GB of physical memory plus 2GB swap memory.
-
I'm not understanding this. You have 21 channels. They are sampled at 10 kHz maximum rate. What is the 10k to 25k situations?
You're going to run out of memory with the example code. I'm not clean on what you're doing that would generate so many long waveforms in one file.
Hi s_tim,
I have a LED driver with 16bit intensity setting (65535 possible dimming steps).
I want to do light measurements over at least 10k out of 65k setpoints.
-
I have trouble working with the huge amount of measured data in my application.
I have made a small example of what I am doing to illustrate the problem.
for a little background info this is what I'm (trying) doing:
I want to measure 21 analog channels with a sample freq. of 10KHz and 1Ksamples/channel over 10k to 25k different situations.
This will result in 21*1k*25k= 525M measurements (I know it is a lot) at max. All this data must be saved to disk and processed later.
The measured data must be of type waveform because later on I want to do FFT calculation on it and therefore I also need the sampling data.
As you might already guess I'm getting a memory full error.
I have tried saving the measured data to a binary file which results in a "memory full" error.
Then I tried to save it to a TDSM file which doesn't result in a "memory full" error but saving takes longer than doing the measurement over again.
Can someone help me how to save and process this huge amount of data?
Many thanks in advance,
arjen
-
Francois thanks for you reply.
I'm still a newby when it comes to LV and don't know where to find the "Lock Front Panel" option.
Where can I find it?
-
Hi all,
I have another problem which I have translated into a simple example.
I have a "ok" button which starts the counter which is made up of several for loop.
However if the for-loop counters are very big it can take forever for the vi to finish.
I have tried different thing to be able to stop the for loops but I can't find a solution.
Does anyone know what to change in my block-diagram so that the abort button can stop the for-loops at any time?
(for some extra info I don't have another event case just this "OK button": Value Change event handler)
best regards,
arjen

-
Hi francois,
Thanks for you reply.
I have tried your suggestion but my program hangs up because the "mouse up" event is not handled in my other event structure.
Even when I add a new case which does handle a "mouse up" event.
Could this be because the "mouse up" event is also triggered when I press (and release) a button on the frontpanel?
The "change value" event for that button is triggered as well as the "mouse up" event.
2 events at the same time mich cause a hang up of the program?
best regards,
arjen
-
I have temporarily solved the afore mentioned problem by adding a timeout trigger to the event structure.
The is fine as long as the 3d graph is not to complicated.
However if the graph is getting more complicated drawing the graph every time the timeout counter expires will be a great load on the CPU.
This was why I was looking for a better solution then using the timeout in the first place.
-
only x-position or also y-position?
Can you post an example of calculation?
ninou
Hi Ninou,
The calculation doesn't really matter.
Lets say I have an indicator on my frontpanel which displays the value of the x-position of the cursor.
The value of the indicator must be updated each time the cursors x-position changes.
This is just an illustrative scenario but the updating of the indicator must be done in an event-structure and not in a while loop.
here are the frontpanel and diagram:


-
I have a 3d plot with a cursor in it.
Depending on the cursor's x-position I want a certain calculation to be performed.
I already have an event structure to handle other controls on the front panel and now I want to have an event,
which is trigger when the cursor in the 3d graph is dragged/dropped. However I don't know how to make this.
Does anyone know how to do this?
thanks.
-
Hello Ben,
Thanks for your reply.
I don't have that option when I open up the property window.
Do I need an extra package to get that or a newer version of LV?
best regards,
arjen
Did you try...
CW3dGraph >>> Properties >>> Graph >>> General >>> Track Mode >>> Cursors
?
Ben
-
Hello,
I'm still a bit new to LV.
Currently I'm using LV 8.6.
I have made a 3d parametric graph which works great.
However I have also added a cursor to the graph but it seams stuck to the point which I have set in the property window.
I have tried enabling the cursor which should make dragging possible.
I have tried all settings of the "snap to" setting.
But nothing seems to work.
Can someone tell me what I need to do to make dragging of the cursor across the surface of the 3d parametric graph possible?
thanks in advance,
best regards,
arjen
-
Hi all,
I'm a newby when it comes to LV.
I have been using it for about 6 months now.
In our company we have an application written in LV 8.5.1 but there are some things I want to improve in the current design.
One of the things I can not figure out is how to color a specific occurrence of a substring within a large string.
To be more specific:
I have a string constant lets say: "peter, henk, harry, marc" which is one big string.
The string constant is directly connected to a indicator on the frontpanel.
I want the substring: "harry" to be the color red.
How can I do this?
thanks in advance.
strange data acquisition
in Hardware
Posted
i have tried that, with the same result.