hova2010
-
Posts
31 -
Joined
-
Last visited
hova2010's Achievements
")
Newbie (1/14)
0
Reputation
-
How do I create fixed X-Axis intervals using Chart Properties?
hova2010 replied to hova2010's topic in LabVIEW General
Hey guys Im almost done with my application, but Im noticing something with timing. My 1 hour chart markers are not keeping pace with the PC clock. This chart plots 1 point every 1 minute....so 60 points = 1 hour I ran my app over the weekend.... I came into work today at 8:00am, but my application's latest marker was at 5:38am? Im still not deleting markers yet. I'm not sure when to delete previous markers or how many markers to delete? Ihave attached the code I use to generate chart markers. J Chart Markers Dont Keep up with PC Time.vi -
How do I create fixed X-Axis intervals using Chart Properties?
hova2010 replied to hova2010's topic in LabVIEW General
My entire grid marker code is attached...
-
How do I create fixed X-Axis intervals using Chart Properties?
hova2010 replied to hova2010's topic in LabVIEW General
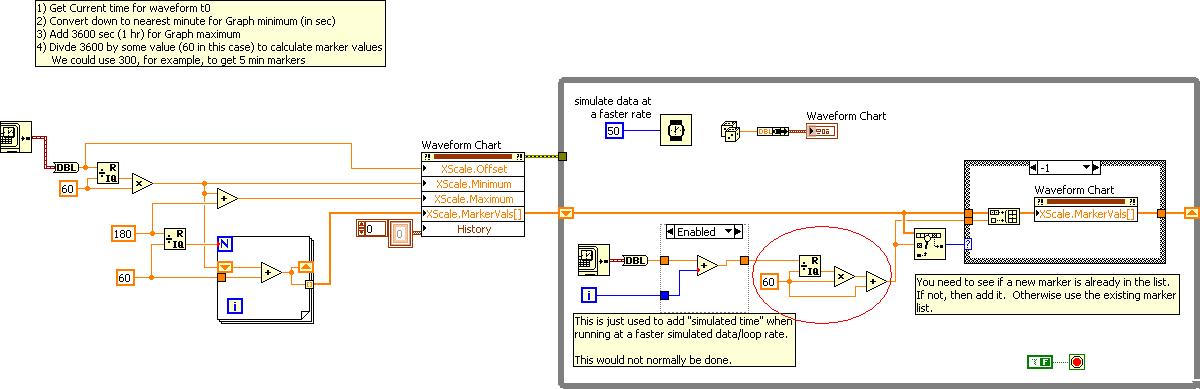
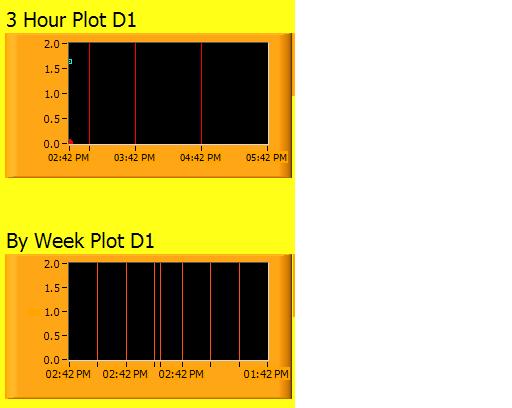
2 Question Scott: 1) The 1st picture is from your VI ,"JH_waveform_graph_markers[1].vi I have circled the divisor, "60" in the picture. Should this number, 60, be changed based on whether Im using markers for minutes, hours, or days? I have the divisor set at "60" for my minute chart, "3600" for my hour interval chart and "86400" for my day interval chart Would these numbers be correct? (see "Waveform Chart Grid Markers.JPG") 2) Using "3600" for hour interval and "86400" for the week chart, Im getting "some extra grid markers" on these charts... (see "waveform chart_extra grid lines.JPG") Can you tell me why? thanks J
-
How do I create fixed X-Axis intervals using Chart Properties?
hova2010 replied to hova2010's topic in LabVIEW General
With The attachment "doesnt work with chart_" .vi , Im trying to convert to a 3 hour graph (1 hr intervals) and also a 1week graph with 1 day intervals doesnt work with Chart__waveform_graph_markers1.vi -
How do I create fixed X-Axis intervals using Chart Properties?
hova2010 replied to hova2010's topic in LabVIEW General
Hey Scott I couldnt open that last example, Im using 8.5.1 Also this new code I wrote doesnt work with a Waveform Chart, but it works with your Waveform Graph. I tried to modify your code to give me a 3 hour time span on the X-axis with 1 hr markers. Do you know why it works correctly in the Graph but not the Chart? J -
How do I create fixed X-Axis intervals using Chart Properties?
hova2010 replied to hova2010's topic in LabVIEW General
Scott I thought I had my Waveform chart plotting grid markers correctly at 1 min intervals, BUT it the chart stops printing grid lines during its run. I attached an example piece of code hat shows my code. When the code is run, you will see the grid lines stop being plotted..do you know why? thanks J JH_waveform_graph_markers1.vi -
How do I create fixed X-Axis intervals using Chart Properties?
hova2010 replied to hova2010's topic in LabVIEW General
Scott Can the same concept be used for a Waveform Chart? I tried to get it to work with a Chart, but it not going well ... Can you tell me what Im doing wrong? J jwaveform_chart_markers.vi -
How do I create fixed X-Axis intervals using Chart Properties?
hova2010 replied to hova2010's topic in LabVIEW General
Thanks Scott This seems to be what I was looking for! Yes, of course, each minute is designated from the absolute time of the previous minute (or start minute)... 2:01pm 2:02pm were just for illustration purposes. Will your graph continue to scroll to the right as the data & time fill the first page? I will need the X scale markers to continue indefinitely until the test is manually stopped. Thanks J -
How do I create fixed X-Axis intervals using Chart Properties?
hova2010 replied to hova2010's topic in LabVIEW General
Here is a picture of my Waveform Chart Im currently using...all I need is 1min intervals on the X axis. And the 1min intervals should be crossed in real time about every 15th data point (since my scan rate is 1 sample/ 4sec) thanks J
-
How do I create fixed X-Axis intervals using Chart Properties?
hova2010 replied to hova2010's topic in LabVIEW General
Hello Scott this is getting closer...what I really want is the 4s data points to move across the graph while the Time intervals on the X-Axis remain fixed. Example : If my scan rate is 4s/ sec, the 15th data point should always cross a 1min interval line on the graph in real time..... So the X-axis may be like this 2:00pm 2:01pm, 2:02pm 2:03pm, etc and the 15 th data point should always match up with a 1min marker I hope Im explaining this better... J -
How do I create fixed X-Axis intervals using Chart Properties?
hova2010 replied to hova2010's topic in LabVIEW General
Here is my attempt at the Waveform Graph Im trying to set 1 min intervals on the X-axis I will have 3 pieces of data average, std deviation, and Time My 1min intervals are not being set by the graph properly Any reason why? Jjh_waveform attempt1.vi -
Here is my application... I have data acquisition system that acquires a data point once every 4 seconds. My Waveform Chart accurately displays my data points on the Y- axis. What Im trying to do is format the X-axis to show the user an accurate time stamp. I have 3 charts....by minute, by hour, by week. I would like to show the 1min chart X-axis in real 1minute intervals...starting from the start of the application I would like to show the 1hr chart X-axis in 1 hour intervals I would like to show the 1 chart graph X-axis in 1 week intervals. I want to use the chart properties i.e. XScale-Multiplier, XScale-Offset, XScale- Minimum, XScale-Maximum How do I use the properties to build the X-Axis for each chart? ~J
-
Ok Scott Here is my application... I have data acquisition system that acquires a data point once every 4 seconds. My Waveform Chart accurately displays my data points on the Y- axis. What Im trying to do is format the X-axis to show the user an accurate time stamp. I have 3 charts....by minute, by hour, by week. I would like to show the 1min chart X-axis in 1minute intervals I would like to show the 1hr chart X-axis in 1 hour intervals I would like to show the 1 chart graph X-axis in 1 week intervals. I want to use the chart properties i.e. XScale-Multiplier, XScale-Offset, XScale- Minimum, XScale-Maximum How do I use the properties to build the X-Axis for each chart? ~J
-
Hello Is there a way for me to have a user click on point within a Waveform Chart and display its Time and Date info? thanks J
-
Hello All I have a Waveform Chart that displays my data points as my test is running. What I need to do is have the chart store the times associated with each plotted value. Example 1: If the chart is running, I'd like to use the scrollbar/ graph pallete to rewind the chart and tell me what time/data in chart history did each data point occur. Example 2: If I found a defective point in an over the weekend test, I would like to scroll back thru the chart data to that point and see the time/ date it occured Can anyone help me with this Waveform Chart scenario? Im using LV 8.5.1 thanks!!! J