Khirsah17
-
Posts
2 -
Joined
-
Last visited
Khirsah17's Achievements
")
Newbie (1/14)
0
Reputation
-
Help with 3D Plotting Features
Khirsah17 replied to Khirsah17's topic in Application Design & Architecture
That's the approach I thought I was taking with my VI, however, I could be doing it wrong. This is the first time I've really used properties and methods. The first plot I add contains the 4 specific points of value, in which I try to change point size and color, and then plot the original data. As the program is running, I think I see 4 points that are connected (don't want them connected), but they don't appear to be any different color or size. So while it doesn't give me an error, I also don't see a change. -
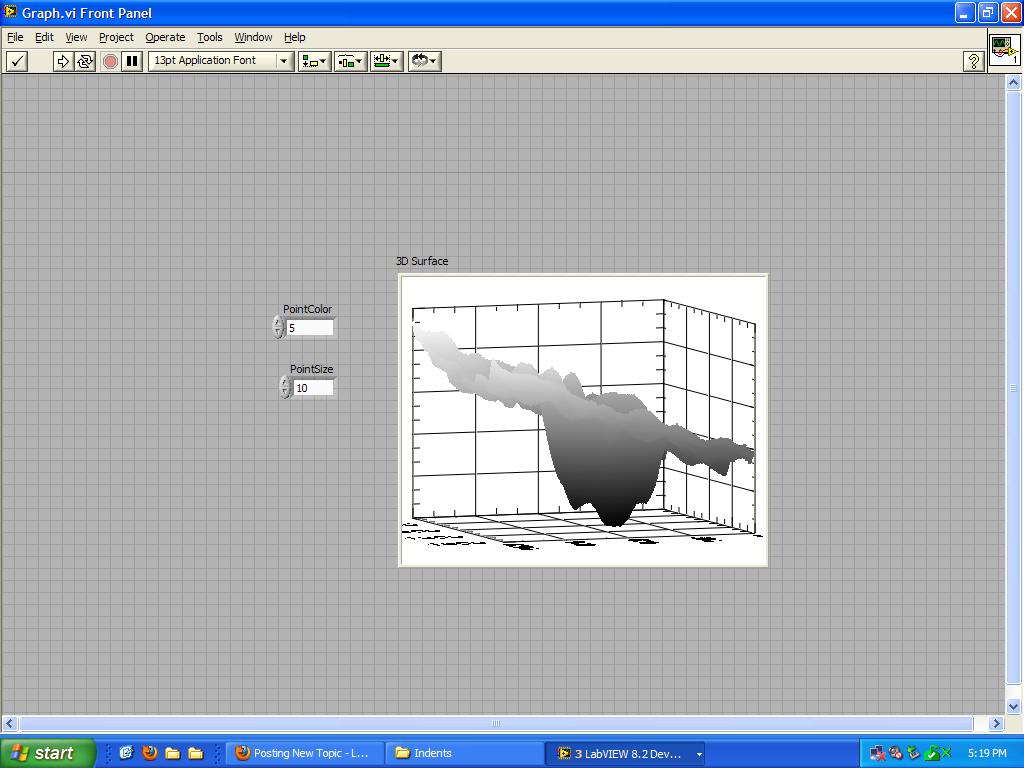
Hello everyone, I've recently started to use LabVIEW for displaying 3D sets of data, and I realized that I know nothing about it! I could use some help with some features that I'd like but have spent countless hours of research and frustration on. Mainly, I have a specific subset of data that I would like to be highlighted on my plot. I'd like to be able to change the color of the specific points and also make them bigger in size so they stand out in contrast to the regular data. This way the user can easily see where the data points are. But I just can't get this to work no matter what I try, so I could use some suggestions. Unfortunately, my data file is too big to attach, but I have a screenshot of the data along with my VI. Thanks! Graph.vi