prescott2006
-
Posts
3 -
Joined
-
Last visited
prescott2006's Achievements
")
Newbie (1/14)
0
Reputation
-
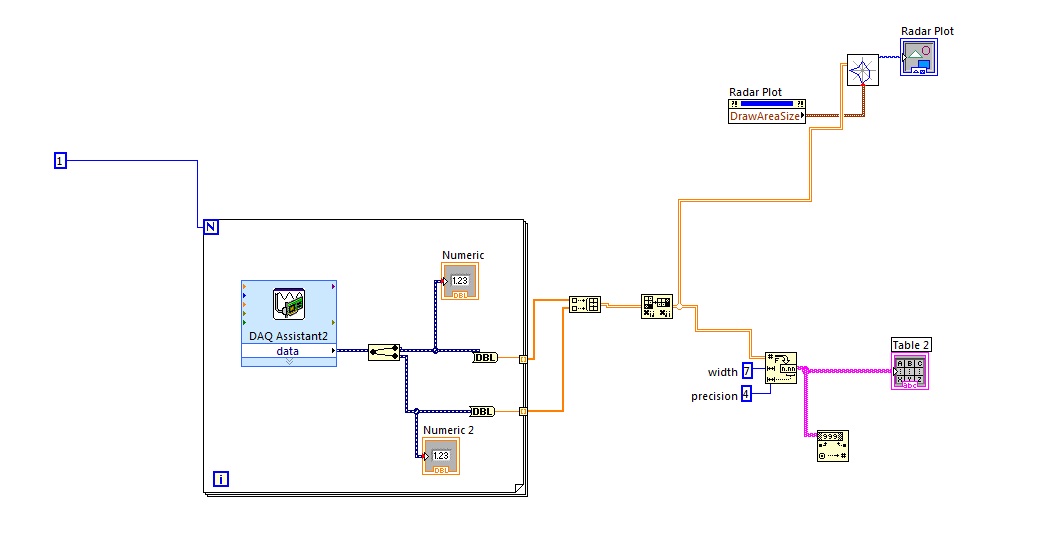
Hi, I need help from you guys. My idea is like this, voltage will be collected from 2 channel of DAQ, and then radar graph will be plotted. I read though the radar plot demo vi come along with Labview but I have a problem. In that example, it is using table control to plot the graph. But what I want to do is continuous update the table and the graph. I know to generate table from DAQ, but i do not know how to make it as a table control to plot the radar graph. Hope somebody can help me. radar.vi

-
Thanks for your reply. If I want to do it in Labview, can you please show me the block diagram as well as front panel? On the other hand, how can I use the MAX to achieve that purpose, I never use it before.
-
Hi, I am new here and I am a beginner for Labview too. I want to design a Labview algorithm for a calibration. The calibration is for pressure sensor, i.e Flexiforce. When I put load on the sensing area then the output voltage will shown in table. The voltage is acquired by using NI USB-6009. For example, when I put 10g, then 10 output voltage sample at 10Hz will shown in column 1 and the average will calculate at the bottom. After that I will put 20g, the corresponding voltage will shown in column 2, and the process continue for N load and voltage stored in N column of the table. After that, a graph will be plotted based on the average voltage and the load. It is possible to do this? I know how to store data in table, but I do not know how to store them column by column and plot them. Can someone enlighten me?