

Vivek Bhojan
-
Posts
19 -
Joined
-
Last visited
Content Type
Profiles
Forums
Downloads
Gallery
Posts posted by Vivek Bhojan
-
-
There is a function "Get System Power Status" under Kernel32.dll, which gives only the system Power Status like On/Off, AC/DC type etc. Can anyone please help me in finding the System Battery Voltage and Current?
-
Hi I am new to Test stand and what is required is, to insert an 1D array of data into a 2D Array.
For example:
Consider a simple sequence:
1. For Loop on n=1 to 15
a. Read Voltage. (Report Value [Table Name= 2D Array, Column=Voltage, Row=1])
End
Thanks in advance
-
Try setting
Advanced >>> Auto Adjust Scales
False
Ben
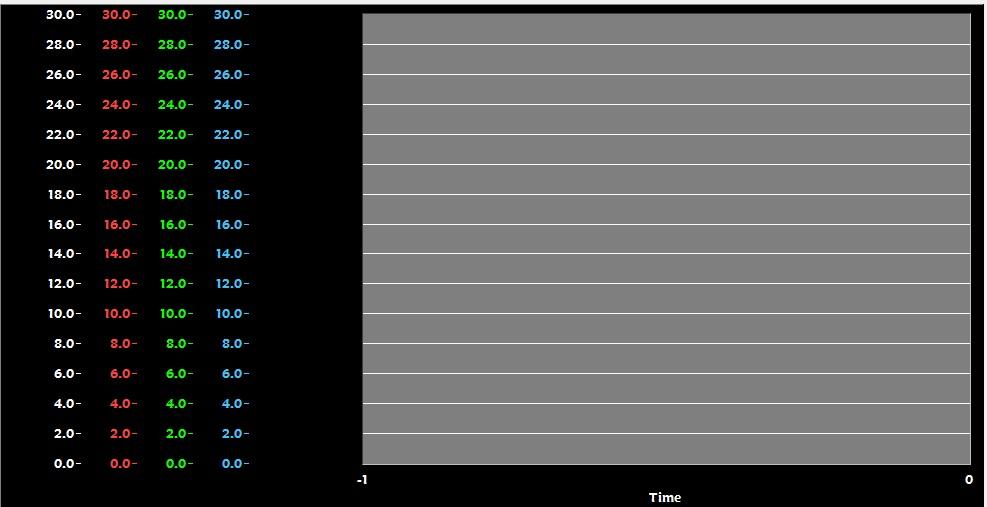
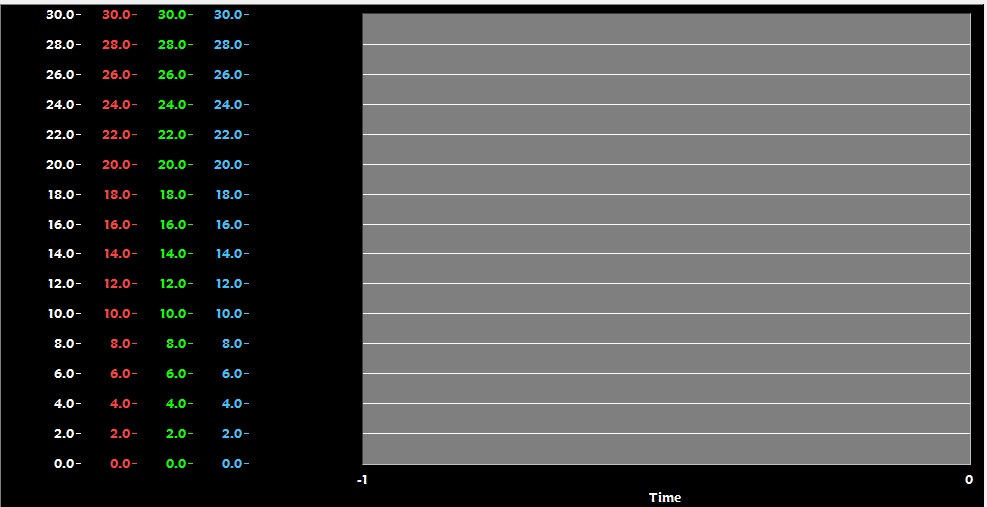
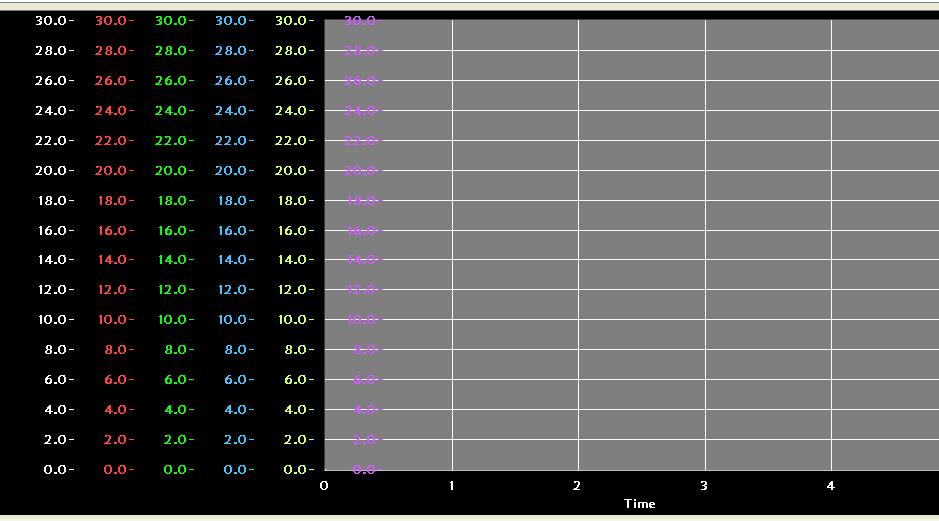
I have tried this option previously, but the output is something like the image attached. There is a space between the Scales and the Plot Area
-
I think you can read the Y Scales Positions, sort through them to find where they start and where they end and then set the property "Plot Area Size" and "Plot Area Position" to reduce/move it so that it doesn't overlap with the scales, I haven't tried though.
Good luck.
LabVIEW Ver 7.1 does not have the option of Plot Area Position.
-
Hello Friends,
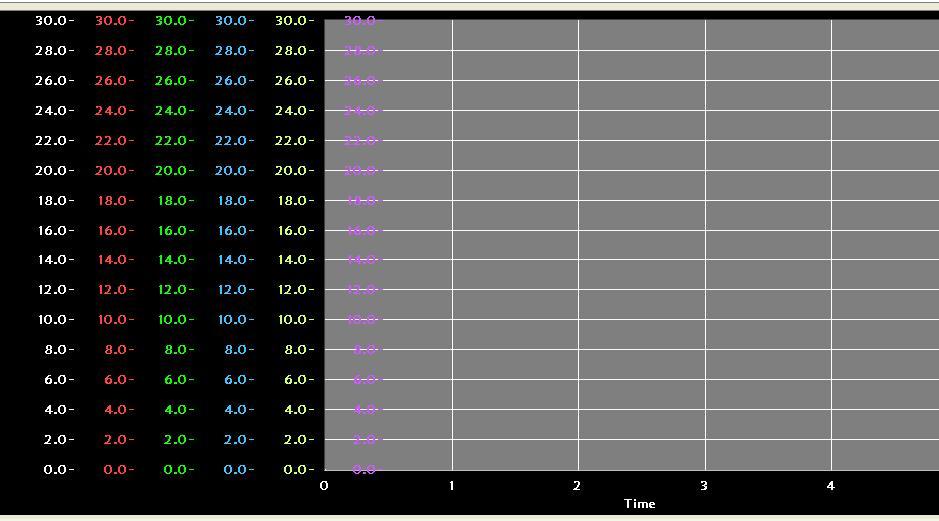
I am using Waveform Chart with multiple Y axis scales. Currently 6 Scales are used and made visible programatically. The Default No of scale is 6.
Now the question is, sometimes when I change the No of scales from minimum to maximum, the scales are overlapped on the plot area. Please see to the attachment.
How to solve this issue.
Thanks
-
with a little bit of imagination

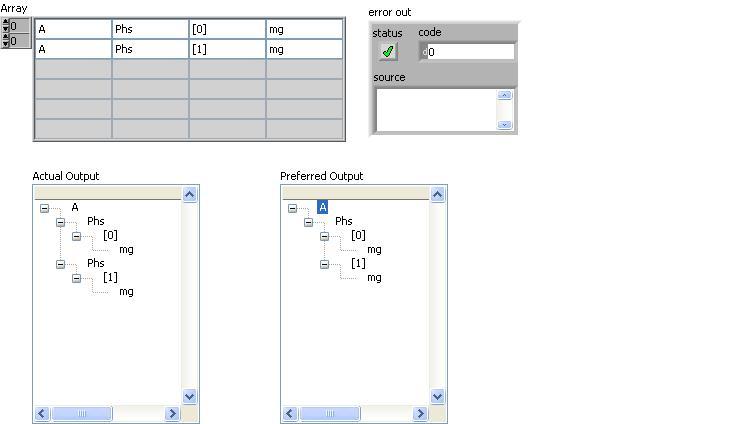
Hello Mr.Antoine Chalon. Thanks for your vi.. I am facing a little problem with the vi.
Please see to the attached image of what exactly is required.
Please help me in order to get the Preferred Output in the Image
-
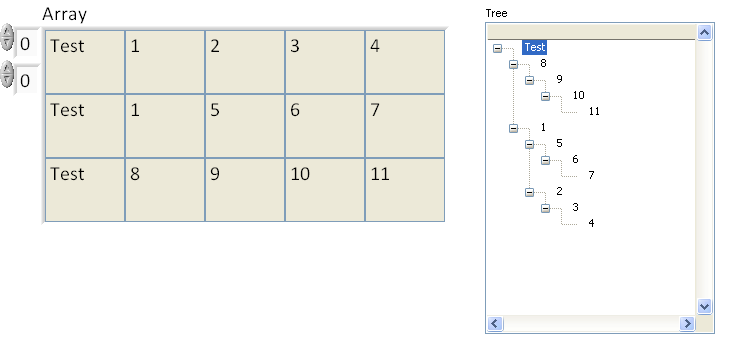
You can only have a tree in column 0. But you can put data in the other columns
How to convert a 2D Array to Tree.
Attached a snap for reference.

-
Can anybody help me in developing a Tree Control with Parent in Col 0, Child in Column 1
-
I suggest you take a look at the Tree Control API.
Hope this helps
This has solved my issues..
Thank you for your valuable suggestion
-
Hello Friends,
I want to implement a Tree Control with for loop (N=3),
In my first iteration the tree control should be updated with Tag "Demo"
Second Iteration: "Demo/Measurement"
Third Iteration: "Demo/Measurement/Converter"
Thank you
-
In the mode of "teaching a man to fish..."
When I was taught LV Basic I and II, I was instructed by Rich Brueggman (the first non-NI person to be certified as an CPI) taught me a lot of subtle point about LV, but the one thing that he said that would have helped you help yourself was...
"When in dout, right-click"
That would have helped you. BTW: It is a good idea to start right-clicking on obects after new LV releases. I have found mant gems under a right-click.
THe other early leason came from my next G-Daddy, Jay Grasel, now a VP with NI) who told me...
"If you don't know how an operator works, do a ctrl-c followed by a ctrl-n."
Ctrl-n is the short-cut for new VI where I drop the opertor and start experimenting.
Like I said, have fun!
Ben
That was an wonderful saying... Thanks a lot Mr. Ben. Cheers...
-
The size of the elements in the cluster can be resized. Pop-up on the cluster n the array adn create property node .... When you resize on cluster the other will do the same.
have fun!
Ben
Now I think I can proceed further.
Thanks Ben and Shaun for your valuable suggestions
-
Array of clusters it is then

Array of clusters is what I am using currently with 2D Array of 4 Rows and 4 Columns fixed. This holds good for 16 Channels.
Suppose if I want to change the no of channels to say 8, then the array should resize to 2 rows 4 Columns (This is possible).
For example: 4 Rows x 4 Cols will be my default array size, when it is changed to 2 Rows x 4 Columns, the size of the array element should increase to accommodate to 4 Rows x 4 Cols Size.....
-
What about 2 arrays One with the headers (channel names) and one with your data. Then you can set the fonts different for each array.
< some time later after copious amount of caffeine >
try this

But my requirement is, in a single cell, I should have two lines. Line 1 = Channel Name - Medium Font, Line 2= Data-Bigger Font
-
... and if you don't like the 2d array of clusters idea you could crate an cluster of 96 elements and hid all o the un-used... but then scrolling would require more work.
Ben
Creating 96 Clusters will make my block Diagram occupying more space..
Is it possible to use Table instead of 2D Array or Clusters. But the difficulty I felt was the font Size. I used the Multiline Input option in Table Enabled. But I am not able to adjust the Font Size for each Line...
-
Hello Friends,
For one of my project I have to use a Front Panel Control which displays Channel Name and Acquired Data. The control should able to display twenty Channels details, with Channel Name in First Line with medium Font size and Data in the Second Line with Bigger Font Size Twenty channels as mentioned above is not fixed... It can be varied run time, aything from 4 Channels to 96 Channels.
Please suggest suitable control to be used which will satisfy the requirements.
Using LabVIEW Version 7.1
Attaching an example image for reference
-
Here is an example of how to create and use callbacks.
Hi vugie,
Thanks for your help..
As I am new to LabVIEW and C, I am not able to proceed with the details given.
Can you please provide a simple logic based on the inputs given by me to continue further.
Thanks,
-
The IEC61850_Associate_Req function has a callback fuction Confirmation as one of its parameters. How do I implement the callback using the Call Library Function node
int_stdcall Confirmation(LPCTSTR Msg)
{
printf("\n***Confirmation (callback)***\n%s\n", Msg);
return 0;
}
result= IEC61850_Associate_Req(request.c_str(), Confirmation, response, 1024);
if(result)
{
return result;
}
In the above program, request and response is an xml based strings.
I am stuck in this logic for past one week.

Picture Ring Control
in LabVIEW General
Posted
Hi Guys,
Is it possible to add Images to the Picture Ring Control Programatically rather using the Right Click option and select Add Image from clipboard.