

kelbro
-
Posts
23 -
Joined
-
Last visited
Never
Content Type
Profiles
Forums
Downloads
Gallery
Posts posted by kelbro
-
-
Using LV 7.1, it seems simple enough but I cannot get the correct time to display in the built in graphs (waveform charts). Any suggestions?
Thanks!
-
I appreciate all of the suggestions. I just wanted to check back in and let all of you know that due to the end of year crunch at my office, I have not had a chance to look at this program any more. I will try to get into it next week and post back up.
Thanks.
-
Thanks for the direction. I have only been messing with this for a couple of hours. I was seeing a single point, centered with the data ranges across X and Y. Tried connecting, the dots. No luck. I will try the SR. That may be the ticket. I need to see the 'knee' where the voltage rolls off at the specified current level.
I will give this a try and report back.
Thanks again!
This is what an XY graph does:You give it a SEQUENCE of ordered pairs and it plots them. If you want lines drawn between ADJACENT points then it will do that. All you have to do is get the sequence in the correct order.
The only way you can get a chart like you describe from voltage and current is if ALL the current data is exactly a particular increment apart and ever increasing.
Is that how your data looks? If the current EVER is less than the voltage then the graph will double back on itself. How could it be other wise?
You can do that and get a scroll effect in this way:
In a while loop you have your XY graph and the single point aquisition function fetching from the two channels, one for voltage and one for current. Every time the loop runs you get a new ordered pair of current and voltage. There is a shift register on the loop (I am going to let you figure out the data structure on your own - if you are going to use XY graphs you need to learn that). Every iteration of the loop adds the new data to the shift register and the XY graph gets its data from that shift resiter.
This way everytime you get new data the data is added to the plot of the XY graph and the graph updates immediately.
Now, here is a question. What is the point of watching the graph build point by point? If there is no good reason, as in you need to make some real time decision based on the readings, then don't do it this way. Simply gather the data in a buffered read and plot it afterward.
I have a feeling that you have not actually plotted anything in an XY graph yet. It would be a good idea to mess around with it if you haven't. Create a data set with a random number generator ands experiment with the XY graph a bit. You can plot the data from to randoms as oredered pair and XY that. Then try to get multiple plots on the same graph. Then you will understand what I am getting at completely.
On second thought attached is an example that makes XY and "clusterrays" them into a multiplot.
-
Thanks Mike. I guess a better description is that I want it to scroll the data points across like the chart below. I am wanting to plot the sample of the Voltage readings from the meter on the Y axis and plot the Current readings on the X axis. My goal is to display the point that the voltage folds back when the current limit is reached.
Thanks
"does not chart," does not compute for me. What exactly do you mean?If I guess what you mean...
The XY graph will graph properly formed ordered pairs. You can plot multiple plots, but I won't try to describe the details of that data type in words, you can look it up. If you want an XY to update with new data you can give it new data. Put it in a loop and it looks like it is growing.
The point of XY is that you are not forced to have ever increasing x data as with "waveforms." A wave is by nature a temporal phenomena thus the x is always increasing by some increment. Waveform data does not even require x data - instead you give it an intial value and the increment.
With an XY you can do tricks like draw a circle around a particular datum programatically or introduce max and min lines, lisajous plots, and so on.
Are you with me?
Mike
-
I have found the XY graph but I am trying to chart Voltage on the X axis and Current on the Y axis. The XY Graph just displays points but does not chart. Any ideas?
Thanks
-
Thanks for the tips.
-
I had to swap out an AC source in a test rack. My program has 240 separate calls to this device. Is there a batch method to 'replace all' with the new instrument driver? I know that I can right click and replace each instance but I was hoping there was a quick and easy way to do it.
Thanks!
-
Thanks Rolf. I wouldn't think that you would need the entire bulky 488 and VISA packages on a computer that you are not doing any development with. I know that with CVI, the standalone executables are pretty skinny and they include all of the support modules required to run. I don't understand why NI cant do the same with LabView.
Because in all LabVIEW versions up to 7.1 the application builder has no possibility to add VISA or any other IO library installer such as NI-DAQ, NI-488, etc. They all do come with the apropriate hardware or can be downloaed from the NI site or copied from the Device Driver CD-ROM. In the case of VISA or even worse NI-DAQ it is not very likely, that everybody would want his installer bloated with 100ds of MBs of driver installation, which someone might have to reinstall anyhow because there has been a new driver version released since you built your app.Rolf Kalbermatter
-
Problem solved! (sort of)
Loaded VISA on the slave computer and now it works.
This prompts the question, Why doesn't the installer bundle up VISA?
I put an indicator on the duplicate VISA output on each device and they display the correct addresses.Is it possible that I am missing something in the 'compile'?
I did try to run NI Spy on the slave computer and I do not see any GPIB activity. The commands show up fine on the development computer.
More info... When looking at the software config on MAX, I do not see VISA. I assumed that it was loaded with the installer. No?
-
I put an indicator on the duplicate VISA output on each device and they display the correct addresses.
Is it possible that I am missing something in the 'compile'?
I did try to run NI Spy on the slave computer and I do not see any GPIB activity. The commands show up fine on the development computer.
More info... When looking at the software config on MAX, I do not see VISA. I assumed that it was loaded with the installer. No?
Thanks for the tips. I will try that tomorrow when I get back to work.One concern that I had was that I found out the test PC was not logged in as administrator. Logged it in as admin and re-tried loading the installer. Still didn't work. Went to remove programs and removed all NI references and plan to start over in the morning.
Here is the sequence that I used: Loaded RTE, loaded GPIB (488), loaded installer.
When you create the application, there is a check box beside load RTE. Why doesn't it load automatically when you check that box?
Thanks again.
-
Thanks for the tips. I will try that tomorrow when I get back to work.
One concern that I had was that I found out the test PC was not logged in as administrator. Logged it in as admin and re-tried loading the installer. Still didn't work. Went to remove programs and removed all NI references and plan to start over in the morning.
Here is the sequence that I used: Loaded RTE, loaded GPIB (488), loaded installer.
When you create the application, there is a check box beside load RTE. Why doesn't it load automatically when you check that box?
Thanks again.
Is there a way for you to verify that the VISA constant is populated with the values you assume are there in an EXE? I would make that contant a control and bring it up to the GUI. Build an EXE with it like this and then you know %100 that the VISA control has this populated properly. -
Doesn't hang, no error message. Just runs right through and never accesses the devices.
Interface is GPIB0 in MAX.
Are you getting any error message from your code? Where is it hanging?Is your interface GPIB0 or is it GPIB1 (plugging or replugging the USB device might cause it to use another device number perhaps).
It has got to be something simple.. its not a big deal to build/install/run exe's.
Neville.
-
Thanks. I am only using three devices besides the USB-GPIB interface. In my program, they are addressed as GPIB0::16, GPIB0::18, and GPIB0::19 in the VISA constant.
Seems simple enough to me, just can't get it to run the devices.
Is your VISA alias on the new machine correctly set up?i.e. if you are accessing com port 1 as "COM1", then on the new system COM1 needs to be linked to Serial port#1.
Same concept applies to the VISA aliases. If your DMM is accessed as "DMM", define it to be the instrument you require.
Or else just use "GPIB::5" in the VISA control or constant.
Try to put an indicator on the front panel that shows you what the VISA string being used by the exe is.
Remember, once you have built the exe and installed the RTE, on the next iteration, simply copy over the new exe and it should run (you don't have to go through the install process again).
Neville.
-
First time creating a Standalone Executable with LabView 7.1. Went through the steps in the app builder. Created the .exe and loaded it on the test PC. Needed RTE. Loaded that. The app ran but did not see the USB-GPIB interface. Loaded that. MAX now sees all of my devices. Program runs but does not access devices. Burned up 4 CDRs so far, what am I missing?
Thanks!
-
Thanks Neville. That's exactly what I was looking for.
-
Hello. Relative newcomer to LV 7.1. I have a series of cases that I select with a U16 ring control. In the interest of creating an international program, what I would like to be able to do is to have the user just click on a picture on my front panel and that would select the case that I need to run? I was able to do this with LabWindows, Is this easy to do in LV?
Thanks
-
Thanks for all of the help. Unfortunately, it will be next Monday before I have a chance to try it out. Heading to the airport. Biz travel the rest of the week and commuting home and back this weekend. 6000 air miles between now and Monday. 3000 of them on Friday.
-
-
Thanks. Yes, that's the setup and the software that I have that does work. I'm wanting to just pull the values out and graph them in a VI.
-
It's a Radio Shack 22-812 DMM. No documentation available except baud rate. I can see that the baud is correct because any other setting garbles the data and it is not consistent. RS has an application that displays the output but I can't use it for my application.
-
I'm getting a string formatted like this: Q
-
Great looking site. First post here. New LabView programmer on top of that.
I have 'inherited' a test setup that uses two Radio Shack RS232 DMMs. I am trying to communicate with them and not having much luck.
When I load the LV Serial Communication VI (in Examples), I can read the data coming out of the meters but it looks like it's just ascii characters, not text.
This is what it looks like in notepad:
Q

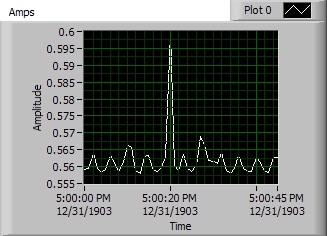
Date/time on graphs
in LabVIEW General
Posted
QUOTE(orko @ Aug 15 2007, 02:42 PM)
Yes, that is selected yet it defaults to Dec 31 1903 5pm.