yas3min
-
Posts
1 -
Joined
-
Last visited
yas3min's Achievements
")
Newbie (1/14)
0
Reputation
-
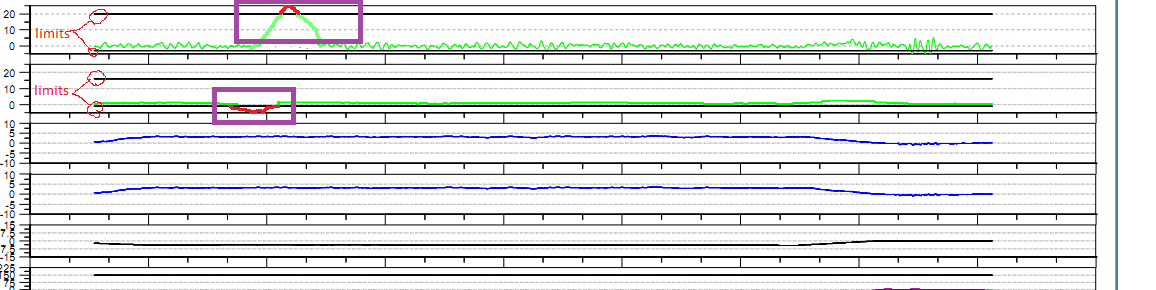
Hello, I want to ask something. I’ve been trying to develop my report of graphs and I have some problems about changing colors. I have more than 10 graphs at my report in each page. For every graph I have limit lines. I want to change the color of the signal in graph where the signal is out of the limits. I uploaded an example picture. Could you please help me about this?