edk
-
Posts
3 -
Joined
-
Last visited
edk's Achievements
")
Newbie (1/14)
0
Reputation
-
Absolute time display on xy graph - not enough info displayed
edk replied to edk's topic in LabVIEW General
Hah! Perfect! I forgot to browse the properties and concentrated on the formatting. Thanks, guys. -
Absolute time display on xy graph - not enough info displayed
edk replied to edk's topic in LabVIEW General
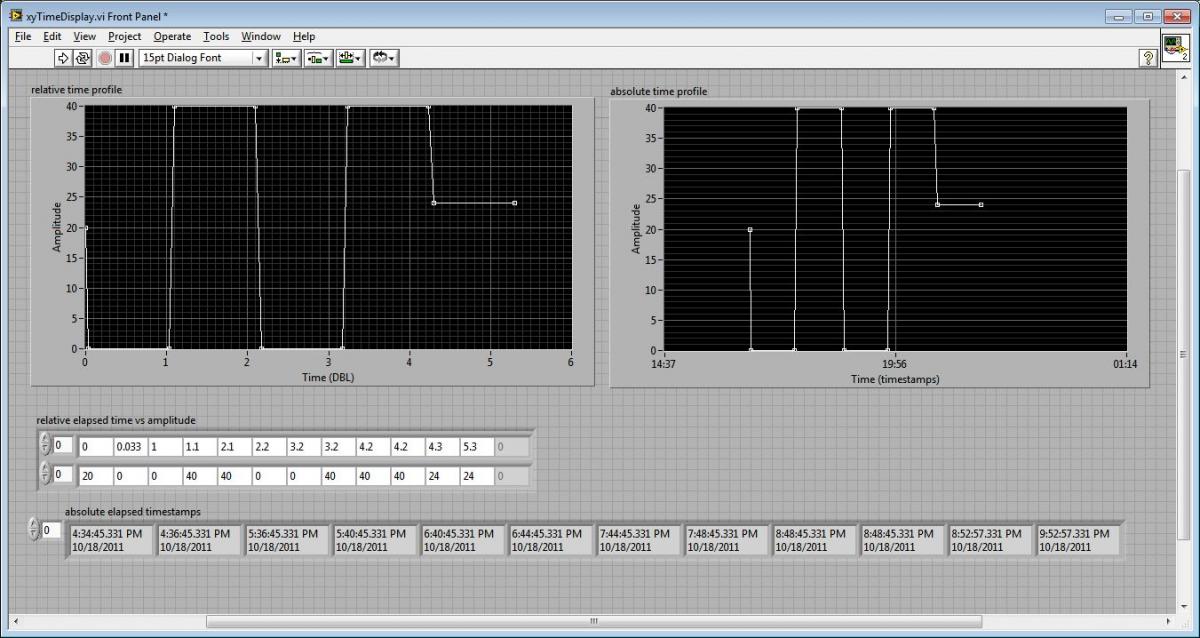
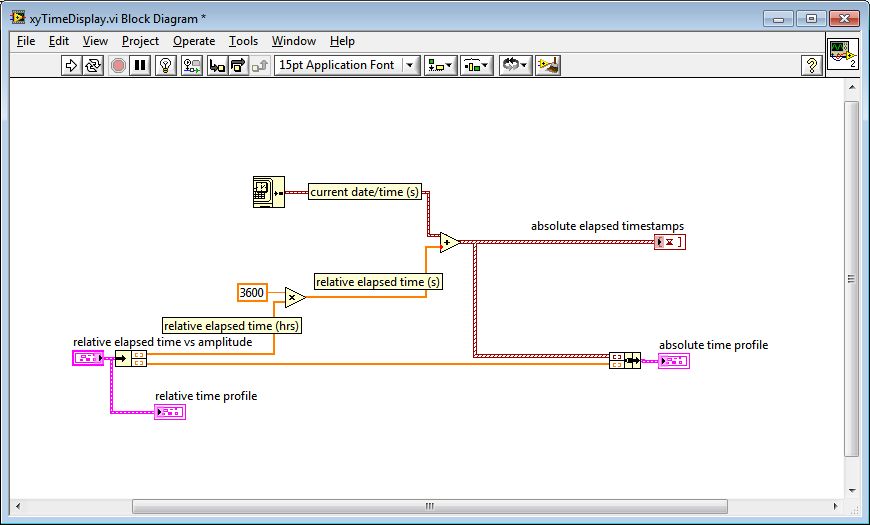
Sorry - what I mean by "incomplete" is that I want to show a time for each (or a few) points in the sequence, e.g. I want the user to know that the temperature will ramp to 0C starting at 18:05, and will soak there until 19:05. I can't get more than 3 times displayed on the axis no matter how I massage the formatting or scale style. Ton - what is an "old" xy graph? I pulled this out of the classic controls palette on LV 2009 and saved it for 8.6. And I see the "offset" in the properties, but don't understand why it's there - this is a xy graph, not a chart. It plots x vs. y, no? The x-scale is built in to the data? -
I have a small pair of arrays and want to display the absolute time at each point, but try as I might, I cannot get the xy graph to display more than 3 entries on the x (time) axis - one at each end and one in the middle. I have used the xy graph many times and thought I knew it well, but I am stumped. This is almost certainly a question of how to set up the formatting on the graph, but - Background - two arrays of 12 DBL each (time, amplitude). When I create the arrays the x-axis is in relative hours (DBL, not timestamps). This bundle displays on the graph with the x-axis formatted for DBL. The numbers are the amount of time, in hours, for each step in the sequence. To display it in absolute time, I convert hours to seconds (hours*3600 seconds/hour) , then add the current date/time timestamp - viola, an array of absolute timestamps. Rebundle and display on an xy graph, and the time display is incomplete. Here are jpegs and the test vi. Thanks in advance. Ed K. xyTimeDisplay.vi