

bobenose
-
Posts
3 -
Joined
-
Last visited
Content Type
Profiles
Forums
Downloads
Gallery
Posts posted by bobenose
-
-
As per the title - I have a VI that has a large saved data set in a mixed signal graph, that, unfortunately, turns out to crash Labview every time the VI is opened, (or even the VI properties are accessed) - can't even drop the VI in the block diagram of another VI without crashing LV.
Any tricks to clearing the front panel graph data without having to open the VI ? Its a 6 or so plot mixed signal plot (4 analog, 2 digital with ~20 digital waveforms in the digital plots) and the saved file is about 22MB (not that big) - but to say the Mixed Signal Graph's performance and behavior is 'poor' is an understatament.
Thoughts and pointers appreciated.
-
Curious if there's a trick I'm missing (and I don't think 'annotations' is it) that would allow a simple plot such as

To be shown with text (think 'enum') instead of the value of the bus.
Typical use would be, such as in a logic analyzer, where a symbol table is used to represent the name of a state in a state machine
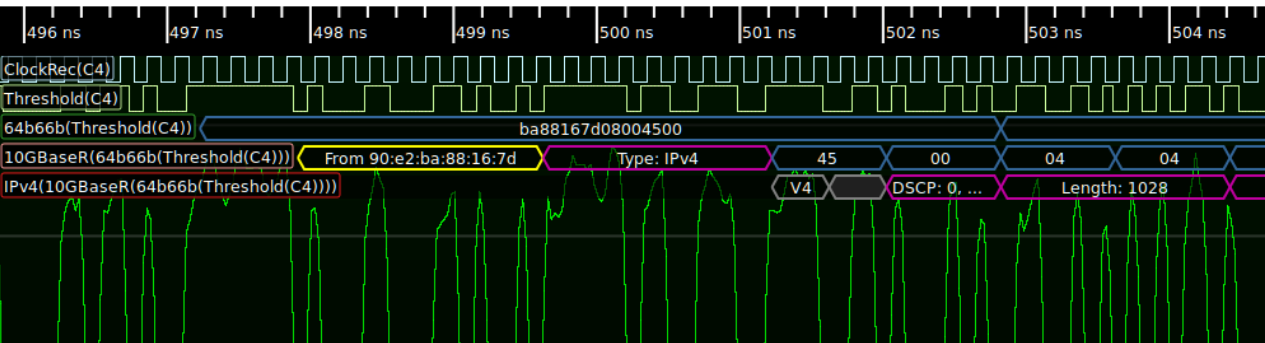
Another use might be to show decoded data (example below from Andrew D. Zonenberg's glscopeclient manual )
My use case needs the Mixed Signal Graph and will involve cursor use, and lots of zooming in/out to review large sets of data quickly, spanning digital (binary, state, etc) and analog signals.
Having a Mixed Signal Graph that can show text, instead of JUST 0, 1, L, H, etc would be EXTREMELY useful and elegant. Running in 2022 Q3 at the moment, I am unaware of this feature in any version from LV 4 (yes, I'm an old timer) through to 2022-Q3 (hence not holding my breath for 2023Q1 to address this)
Sure, with a bunch of work, I could recreate the Mixed Signal Graph with a picture control and get the effect I'm after -- but LV's supposed to be making things easier and faster - if I have to go to that level of effort, another language may win out
A graph that can take an enum and show the String of the enum (rather than the value) in the GRAPH (not on the axis) would be phenomenal
Thoughts appreciated.
Saved data on Mixed Signal Graph crashes Labview (2022 and 2023 Q3) - any way to clear data without opening VI?
in User Interface
Posted · Edited by bobenose
Hi Darren - I am still having issues with this -- I have upgraded to 2023 Q3 Patched -- the VI is rather large (poor choice on my part to save the data... I had reasons...) How is the best way I can get this to you?
Happy Holidays, I realize it may be a bit before I hear from you (despite my delay in response, this is still an important concern for my current research needs)