bobenose
-
Posts
5 -
Joined
-
Last visited
-
Days Won
1
Recent Profile Visitors
1,644 profile views


bobenose's Achievements
")


-
Answered: https://www.ni.com/docs/en-US/bundle/labview/page/understanding-url-mappings-and-query-strings-in-web-services-real-time-windows.html?srsltid=AfmBOopGM5Aom7rH3ofPKKWSHNo1Ye6RrmFtwG6Zh_QJFtInuTGsTOJO Future me (or you) - simply set the Web Service Properties -> HTTP Method VI settings -> URL Mapping to something such as <base url>/path1/path2/:variable1/path3/:variable2 ) and variable1 and variable2 will be passed into the VI as a path parameter rather than the query parameter (eg: <base url>/path1/path2/path3/?variable1=___&variable2=_____ )
- 1 reply
-
- 2
-

-
Specifically - I am looking at emulating an existing REST api that is in the style: /command1/command2/<variable>/command3-related-to-variable one example where this occurs is with network devices port or VLAN ids (eg: <url>/port/3/speed ) Obviously if it is my REST api, I could just do /port/speed and have a variable passed for the port number (eg: /port/speed?port=3 ) -- but I don't get to define everyone's API... In my case, I am trying to emulate such behavior, so I need to setup a web resource that (ideally) would behave identically to the API, hence /port/3/speed etc is desired. But I see no obvious way to do so in LV (2024 SP3)
-
Hi Darren - I am still having issues with this -- I have upgraded to 2023 Q3 Patched -- the VI is rather large (poor choice on my part to save the data... I had reasons...) How is the best way I can get this to you? Happy Holidays, I realize it may be a bit before I hear from you (despite my delay in response, this is still an important concern for my current research needs)
-
As per the title - I have a VI that has a large saved data set in a mixed signal graph, that, unfortunately, turns out to crash Labview every time the VI is opened, (or even the VI properties are accessed) - can't even drop the VI in the block diagram of another VI without crashing LV. Any tricks to clearing the front panel graph data without having to open the VI ? Its a 6 or so plot mixed signal plot (4 analog, 2 digital with ~20 digital waveforms in the digital plots) and the saved file is about 22MB (not that big) - but to say the Mixed Signal Graph's performance and behavior is 'poor' is an understatament. Thoughts and pointers appreciated.
-
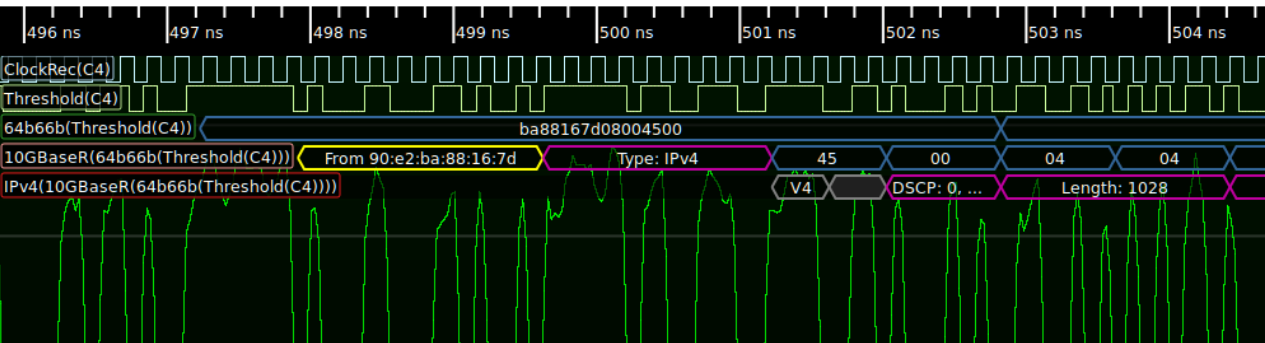
Curious if there's a trick I'm missing (and I don't think 'annotations' is it) that would allow a simple plot such as To be shown with text (think 'enum') instead of the value of the bus. Typical use would be, such as in a logic analyzer, where a symbol table is used to represent the name of a state in a state machine Another use might be to show decoded data (example below from Andrew D. Zonenberg's glscopeclient manual ) My use case needs the Mixed Signal Graph and will involve cursor use, and lots of zooming in/out to review large sets of data quickly, spanning digital (binary, state, etc) and analog signals. Having a Mixed Signal Graph that can show text, instead of JUST 0, 1, L, H, etc would be EXTREMELY useful and elegant. Running in 2022 Q3 at the moment, I am unaware of this feature in any version from LV 4 (yes, I'm an old timer) through to 2022-Q3 (hence not holding my breath for 2023Q1 to address this) Sure, with a bunch of work, I could recreate the Mixed Signal Graph with a picture control and get the effect I'm after -- but LV's supposed to be making things easier and faster - if I have to go to that level of effort, another language may win out A graph that can take an enum and show the String of the enum (rather than the value) in the GRAPH (not on the axis) would be phenomenal Thoughts appreciated.