ishan5590
-
Posts
3 -
Joined
-
Last visited
Content Type
Profiles
Forums
Downloads
Gallery
Everything posted by ishan5590
-
Thanks a lot Gary! I don't really know how a matched filter works. But I will definitely find out and try to implement it the way you said! thank you everybody! Ishan
-
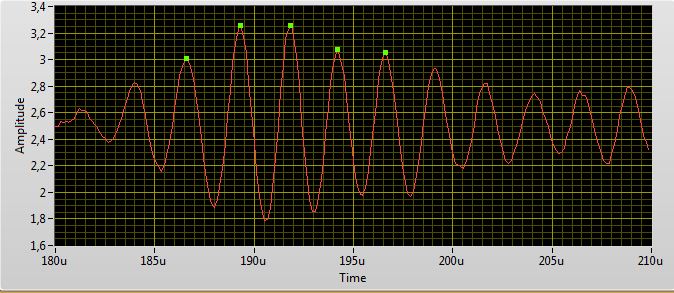
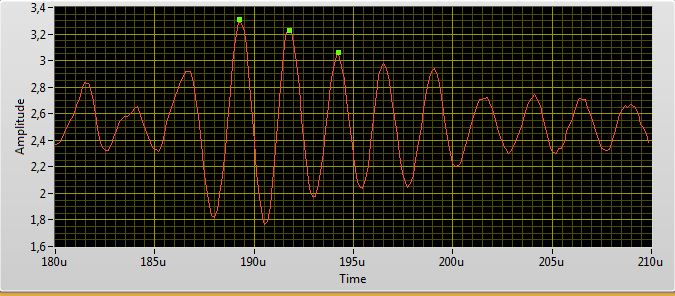
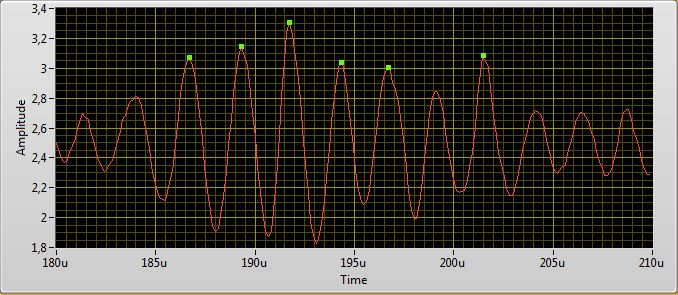
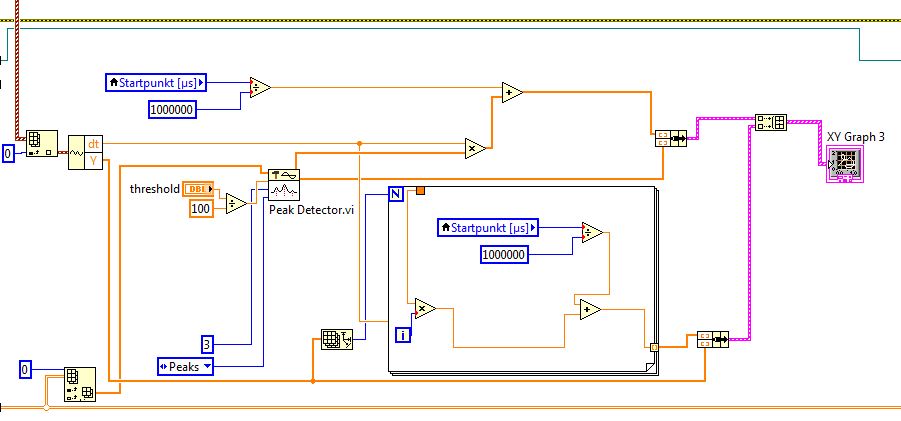
Hi, Thank you for the quick reply guys. However, i dont think i was able to explain myself earlier. My problem at the moment is not really the technical part of "how" to do a certain thing in labview. It is more of a problem with the algorithm. SO i will try and explain my explain properly. @Jordan Kuehn: The information you gave was quite helpful. I am actually doing something similar. I am using the peak detector VI and logging time value of each peak. (attached picture VI). But this information is not reliable. In the files attached with this message, you will see 3 graphs. These are three different measurments taken at exactly same input parameters. But since my signal is an echo, and it is not in an controlled environment right now, as it should be, I am getting variations in each of the three outputs, for exactly the same input. For eg. Currently if i take the time value of the highest peak as my time value. Then it is not a reliable value because the time at which highest peak occurs changes, even though the input is the same. Now, I need to develop an algorithm, where i can use certain characteristics or combination of characteristics of the signal (eg. amplitude or peaks or anything else) and measure find a time value which is steady. I hope I was able to explain my problem better now. Any help in this direction is highly appreciated. Thank you infinitenothing and Gary Rubin for your responses.

-
Hi everyone, I have learnt a lot about LabVIEW programming from this website and this forum. However, this is my first post on the forum. So I have managed to get a signal, which is in time domain, with the amplitude in volts. It looks like the in the picture attached. The above signal is the raw signal, and the one below is a cropped section of the part of the above signal I am interested in. The increase in amplitude seen in the cropped section is an "echo" of the transmitted signal. The cropped signal starts again from time=0, but that can be taken care by simply adding the time, at which this signal was cropped. The task is to find at what "time" does the echo occur. Since the "echo" is spread over a considerably large distance over the x axis (time axis). I need to process the signal with some algorithm so that the echo can be measured at one reference point everytime, which represent the position of the echo on x axis. I am trying to use a peak detector VI and I am getting the value of indexes, where the peak is occurring. However, only peak detection is certainly not reliable. Any inputs on what methods or combination of methods could be used for this task?? Any help would be greatly appreciated!! Regards Ishan