cpipkin
-
Posts
10 -
Joined
-
Last visited


cpipkin's Achievements
")
Newbie (1/14)
2
Reputation
-
Nice. Thanks, Hooovahh. This certainly simplifies the code & makes it easier to look at. It also solved the graphing issue i was having. Now that the graphing problem is fixed, I'm finding that this still isn't working... Perhaps it's because i'm bundling the band center frequencies instead of creating an XY? I will work on it. Octave Band Levels_Simplified.vi Waveform Butterworth Filter.vi
-
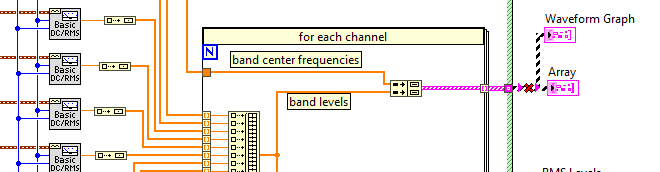
Hello, I am working on code that will read a waveform of a sound pressure measurement and calculate the octave band levels. I would be incredibly grateful if someone could take a glance at my code to see what I have wired incorrectly... The issue I think I'm having: The output of the "Basic Averaged DC-RMS" output wont index when I put it into the for loop. I tried to get around this problem by building arrays for each RMS output and then indexing into the for loop. Doing this doesn't allow me to graph the output... Any ideas as to why the "Basic Averaged DC-RMS" wont index directly? The code (inspired by new NXG example) is attached, both VI's must be downloaded in order to run the "Octave Band Levels" VI. Also, I'm aware that LV has a toolkit for sound analysis & octave band analysis... but I do not have access to this toolkit, which is why i'm trying to write my own VI. Thanks in advance! Octave Band Levels.vi Waveform Butterworth Filter.vi

-
Hi @hooovahh! Thanks for the feedback. I used that express VI just to make a quick example. I've attached a more representative version of my actual code. I've included the read TDMS of your code. What do you think? Is there a way to preserve the X-Axis in the TDMS file? If not, any other approaches? I would like to be able to preserve as much data as possible in 1 single file. TDMS Waveform Example.vi
-
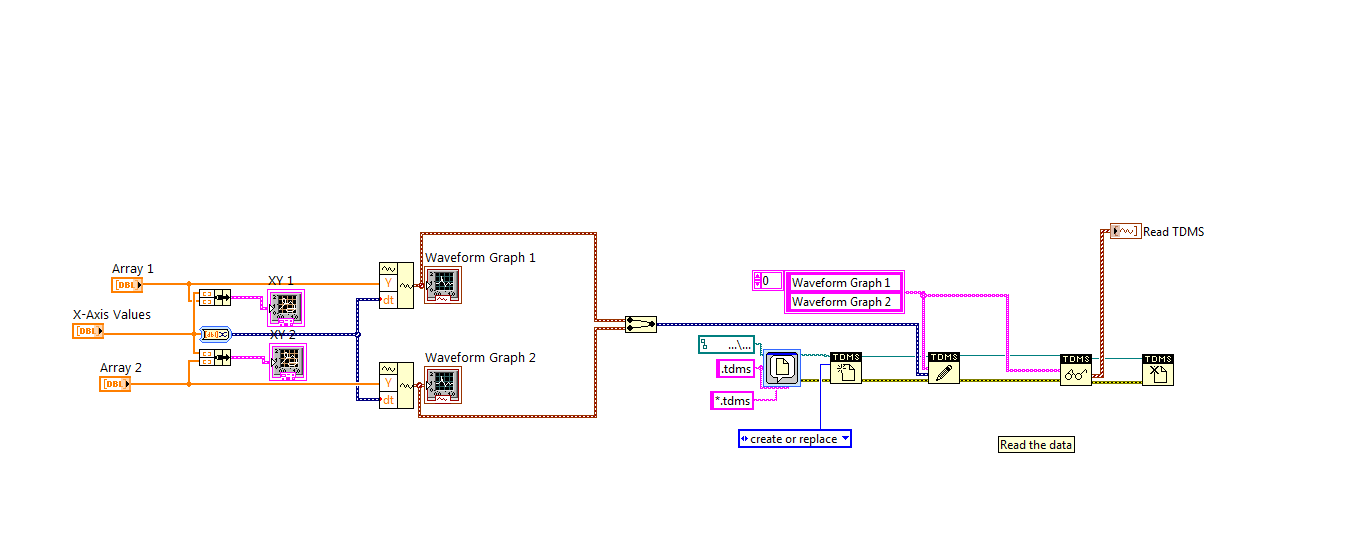
Hello I am trying to save TDMS files that ideally contain the following: - 3 xy graphs (each containing two 1d arrays) - 1 waveform The problem i'm running into is that when I convert the xy graphs to waveforms, the x-axis is converted to time, which isn't real or useful to me. I've attached screenshots of what the XY graph should look like VS what it ends up looking like with the waveform. How to I make sure the x-axis is preserved so that I can save to TDMS? Edit: VI is included & pictures have been updated to better represent my code. TDMS Waveform Example.vi
-

SubVI Not Looping - Simple Universal Instrument Tuner
cpipkin replied to cpipkin's topic in LabVIEW General
@Manudelavega -> thanks! I thought they were connected for some reason. I solved it by giving each listbox a slot on the pattern terminal. -
Hello, I'm using the subVI "String Selector.vi" to select the frequency I need to tune to. The "Instrument Tuner.vi" determines whether or not the instrument's frequency is sharp, flat, or in tune. When I run "string selector.vi" independently (in a while loop or running continuously), the output / "desired fundamental frequency" updates quickly and correctly. However, now that I am using it within the Instrument tuner VI, it does not update. My goal is to get the "Desired Fundamental Frequency" to update if i click on a different instrument / string the same way it does when I click octave1, octave2, or octave3. Any ideas as to how i can get the desired fundamental frequency to update correctly? Thanks! instrument tuner.vi String Selector.vi
-
Logging 4 Channels to TDMS - am I losing data?
cpipkin replied to cpipkin's topic in LabVIEW General
@hooovahh so far this is working beautifully with simulated data. I've increased the buffer size to 280 (10x the loop) just to try and reduce system resources... it doesn't seem to be a problem now, but might as well play it safe! I'm going to test it tomorrow with real data and will let you know how it goes. -
Logging 4 Channels to TDMS - am I losing data?
cpipkin replied to cpipkin's topic in LabVIEW General
Hooovahh, thanks for the insight. I am actually measuring wire that is moving through a laser micrometer at 14 inches per second. The reason i'm reading (and averaging) 28 samples at a time is so I can measure the wire every 0.25 inches. I like the idea of building a buffer of samples and then logging that buffer at once. Would this mean a for loop within the while loop i already have? I can't quite picture how this would be done. Thanks! -
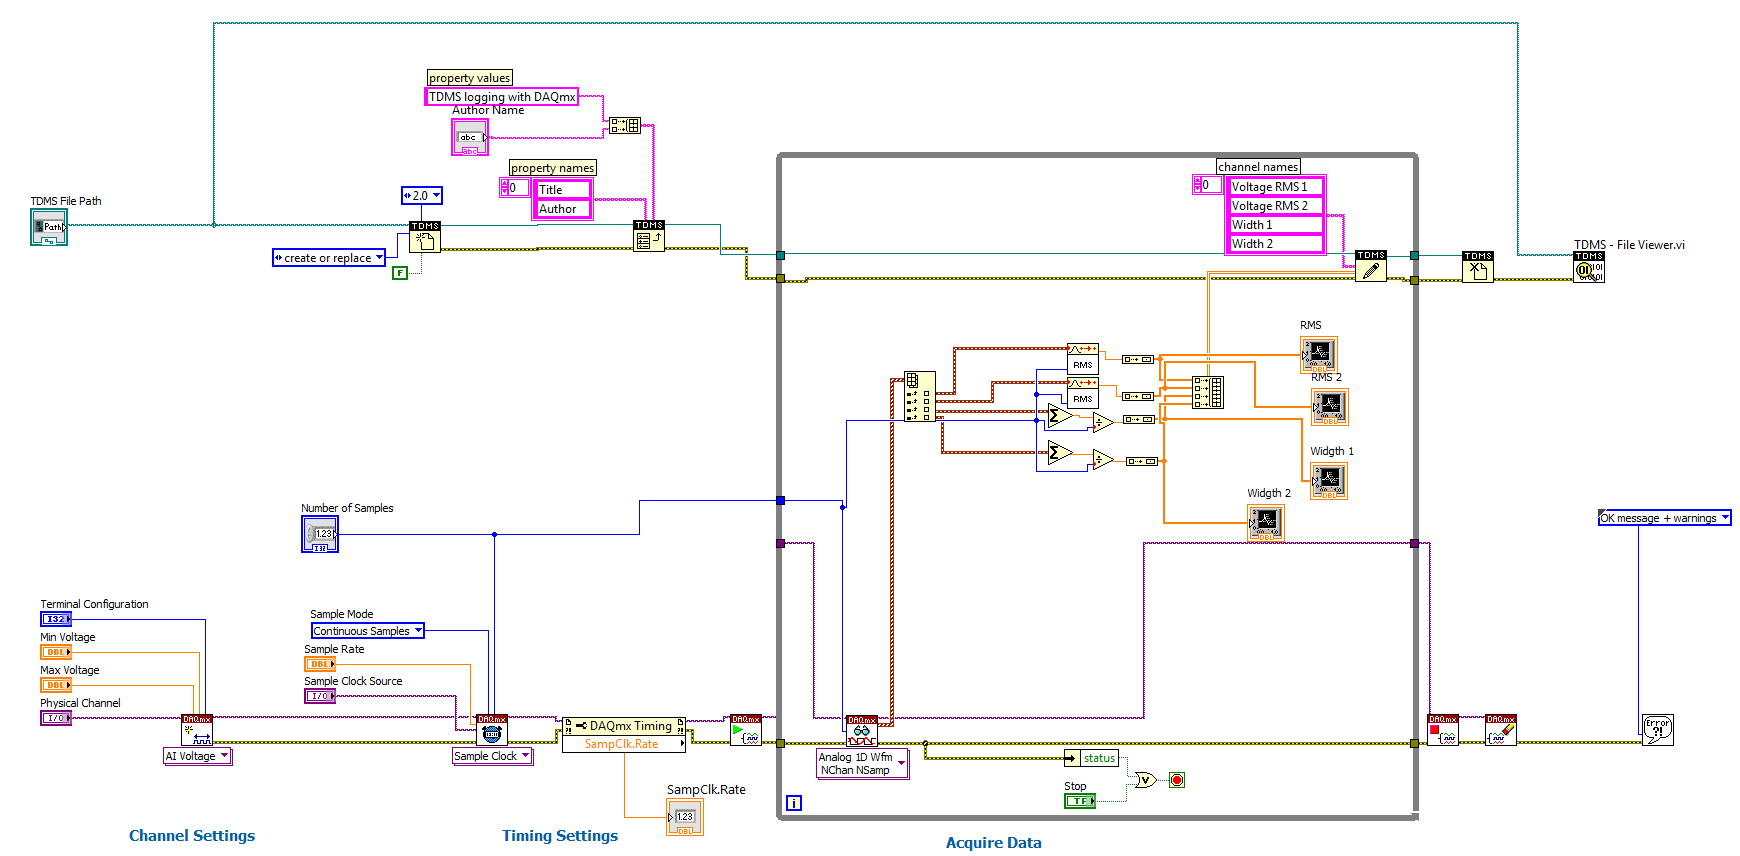
Hello, I'm using the 9229 and borrowed a community example to log 4 voltage inputs to TDMS. I need to output RMS voltage on channels 1&2 and the wavform on channels 3&4. Essentially what I've done is averaged channels 3&4 using the same # of samples that the RMS is averaged, that way I'm able to make sure they are time synchronized (see code attached). Another advantage doing averaging the samples is that I am reducing the amount of data to analyze later. When i compare the TDMS read results to the # of samples in the TDMS file there seems to be a discrepancy in time. I tried to add a time stamp to the logged TDMS file but couldn't get it to work. besides using time stamps, Is there an easy way to confirm that I am saving all of the data I am capturing? Eventually i will be logging data at 30min-40min intervals so I want to make sure that i'm not losing data. TDMS_Logging_Simple_4chan.vi