Good morning,
Firstly, thanks James for creating the excellent SQLite and JSONText libraries.
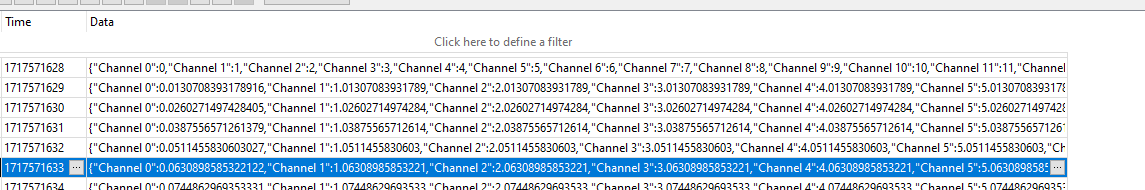
I've been working on a proof of concept for storing time series data into an SQLite database. As it stands I've decided upon a simple table, with two columns, Unix time (as my PK) and Data as a JSON string with an unknown number of channels e.g;
The schema is;
CREATE TABLE [Data_1s](
[Time] PRIMARY KEY,
[Data]);
CREATE INDEX [idx_time] ON [Data_1s]([Time]);
Currently my example dataset is 50 channels at 1Hz, for 1 day. I'm aiming to test this for a years worth of data.
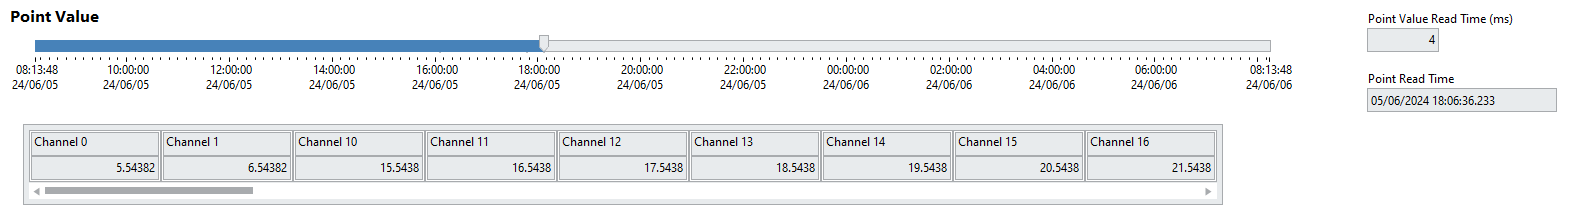
Point Values
I'm getting very good performance when extracting an individual time row (e.g. via a slider between the start and end time of the data set);
The current query I'm using is based on an older form of storing the time (as a decimal) so I searched for a 1s period;
SELECT Time, Data
FROM Data_1s
WHERE Time
BETWEEN 1717606845 AND 1717606846
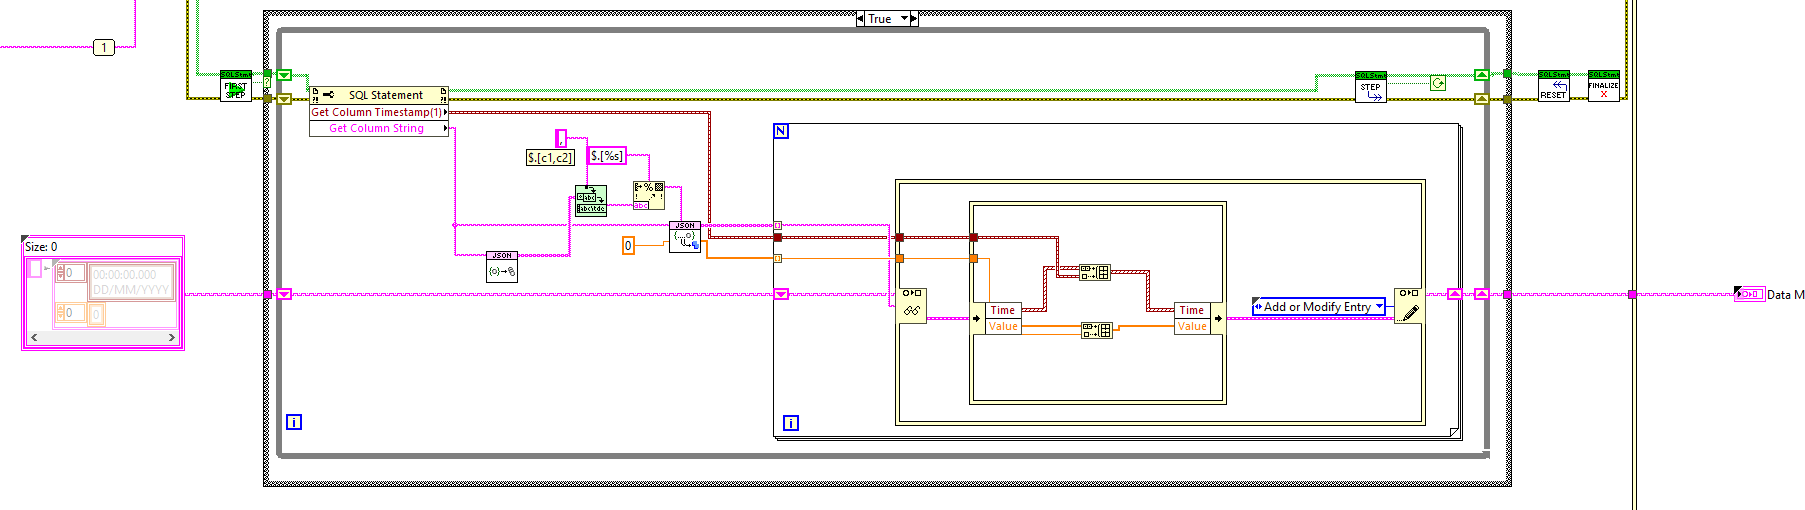
I then collect the results, extract the individual channels from the JSON data and pop it into a map;
This of course can be optimised, but given it is sub 5ms, it is plenty quick enough for interacting with the data via a HMI.
Graph
Anyway, when it comes to extracting XY data to display on a graph, I use the following to for example only extract Channel 0;
SELECT Time, json_extract(data,'$."Channel 0"') AS Channel_0
FROM Data_1s
WHERE Time BETWEEN 1717656137 AND 1718860565
In the above example I read 1892 elements from the database, and it takes ~ 19ms. Fast enough for the user to drag a slider around and change the time window.
However, if I go for my full example data window, e.g;
SELECT Time, json_extract(data,'$."Channel 0"') AS Channel_0
FROM Data_1s
WHERE Time BETWEEN 1717571628 AND 1718860565
It takes 852ms to read 86400 elements. If I go for all 50 channels it increases to 8473ms.
Now with a graph with of a 2000 odd pixels, there isn't much point in loading all that data into LabVIEW, so I implemented an average down sampling query, based on an interval size;
WITH TimeGroups AS (
SELECT
(Time/60) *60 AS TimeGroup,
json_extract(data,'$."Channel 0"') AS Channel_0
FROM Data_1s
WHERE Time BETWEEN 1717571628 AND 1718860565
)
SELECT
TimeGroup,
AVG(Channel_0) AS Avg_Channel_0
FROM TimeGroups
GROUP BY TimeGroup;
This takes 1535ms to run, returns 1441 elements. This is worse than reading the 86400 elements and letting LabVIEW manage the down sampling.
#
The questions I broadly have are;
Am I totally off base with the schema and using JSON to store the (unknown) amount of channels?
Should I be looking at a different way of down sampling?
How are large datasets like stock prices stored and distributed to display on the internet? Some must have very long time series data spanning over decades!
How do you store and quickly extract datasets for display?
Although I feel my questions are pretty broad rather than code specific, I can package it up and share after I strip a bunch of bloat out as it still very much a POC if that would help.
Thanks
Peter