

mermeladeK
-
Posts
14 -
Joined
-
Last visited
Never
Content Type
Profiles
Forums
Downloads
Gallery
Posts posted by mermeladeK
-
-
Well, I think the title is already quite explicit.
I have three VI's running at the same time in a slow labtop. I'd like to know if I can make my system run faster by creating an .exe or not. Otherwise I guess I'll have to enhance the code... :'((
Oh another question: do graphs that show 1M points make the VI much slower?
Thanks!
-
Hi,
Following SciWare suggestions I found the problem. It was about estimating one of the parameters. It still gives me an error which I have to find out why, but it gives a good curve now.
I'll post more about it once I solve the last error.
Thanks.
-
-
Ok,
I'll be waiting for your answer.
 )
) -
Hello,
Because I am new at this I can't manage to know if a VI can output, more than once, data through the same output.
For instance a loop (with autoindexing disabled) just ouputs the last value. But what if I need to get all the middle results?
Or imagine I want to do continous acquisition and I cannot store all the data at once in the VI. I would need to put out pieces of data every certaing time.
Thank you,
Nil
-
QUOTE(Neville D @ Feb 26 2007, 10:37 PM)
Why don't you post the VI's (and data if any) instead of a picture of the BD.. that will save people time in trying to re-build your work just to re-create your error.Neville.
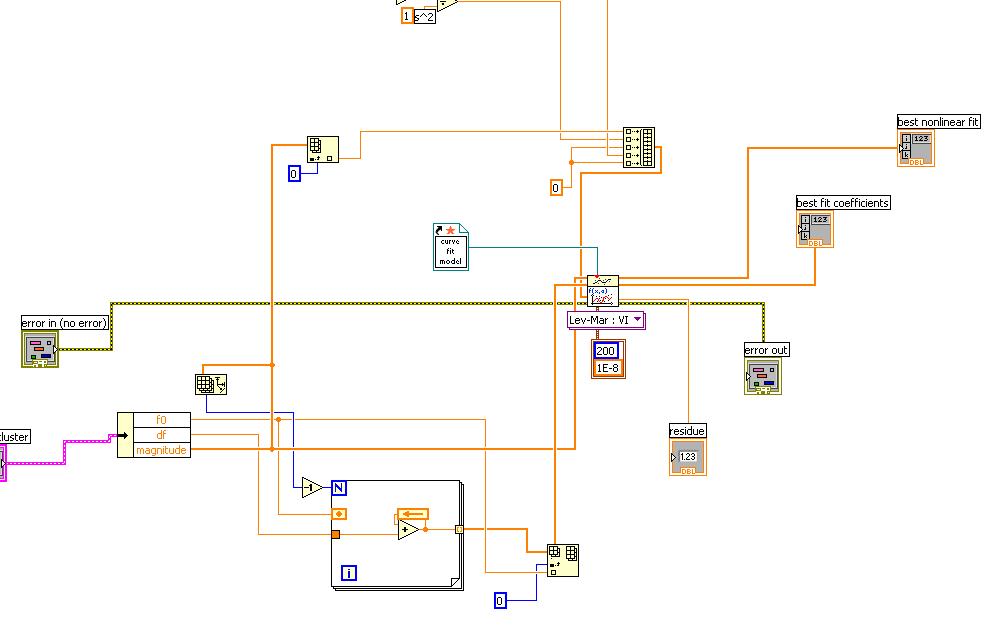
Here are the VI's. The main one is the one with the word "TEST" in the name. The other 2 are subVI's. The "Acquire 1 divided by f idealized spectrum parameters.vi" is the VI supposed to use the Non linear curve fit.
Nil
-
QUOTE(mermeladeK @ Feb 16 2007, 11:39 AM)
As soon as I come back and get working on this again I'll tell you if your answer is right. However if I remember well, the last data in the graph was non-zero. I'll try to plot a logaritmic graph so that it is easier to see it's non zero.Here I am!
Well, I checked what you said and... it's not about the zeros. I tried a different input for the Nonlinear Curve Fit VI and it keeps saying again the same thing: NI_Gmath.lvlib:Nonlinear Curve Fit LM.vi.
Does any1 have an idea of what is the problem with this VI?

Attached the input waveform:
-
As soon as I come back and get working on this again I'll tell you if your answer is right. However if I remember well, the last data in the graph was non-zero. I'll try to plot a logaritmic graph so that it is easier to see it's non zero.
QUOTE(Neville D @ Feb 9 2007, 06:58 PM)
The last bit of the data seems to be trailing off to 0. That might be the problem.Neville.
-
Hello SciWare,
Sorry for the delay. I thought I had posted a message on wednesday but it seems I didn't.
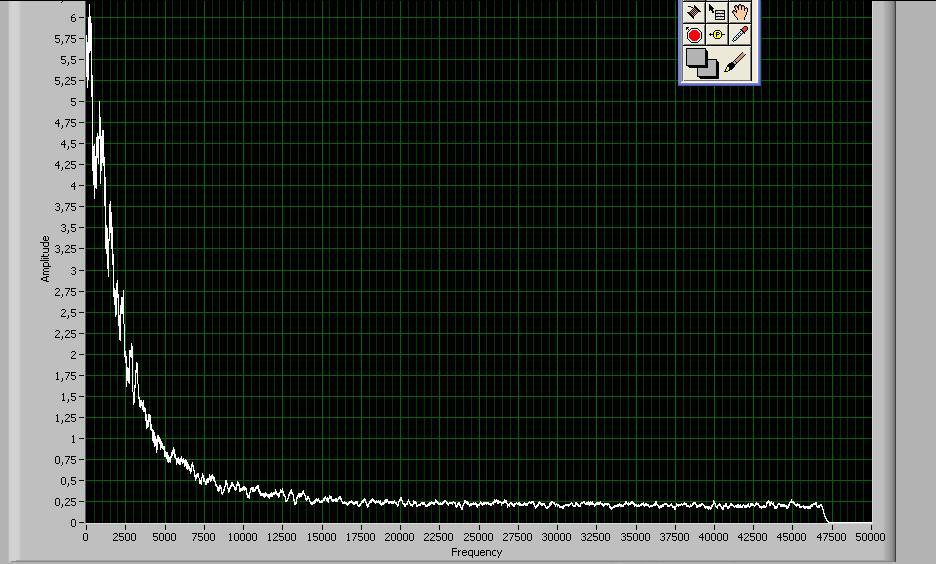
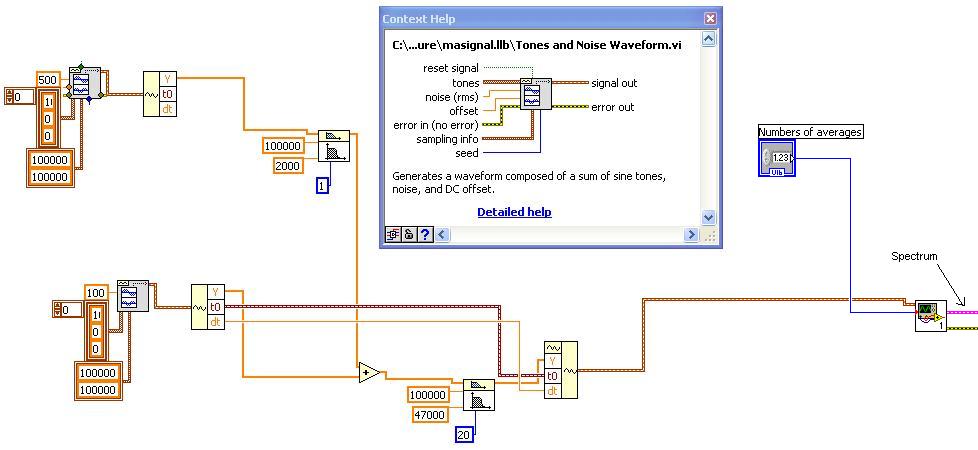
The data wired to the Block is in the next picture. It is a spectrum of a 1/f noise plus a white noise.
I also attach a graph plot of the data contained in the array in the cluster of the spectrum graph.
Nil

-
Hello,
I have a spectrum from a signal and I know how it should be theorically: A/(1+Bf**2)step(D-f)+E
...where f is frequency.
...where A, B, C, D and E are constants that I want to get from the real data.
To solve this problem I try to use the "Non linear curve fit.vi", but it keeps saying:
Error -20041 occurred at NI_Gmath.lvlib:Nonlinear Curve Fit LM.vi
Possible reason(s):
Analysis: The system of equations cannot be solved because the input matrix is singular.
I checked if the array of independent and dependant values are equal, I checked the fitting model and everything seems ok.
You know why it keeps saying the input matrix has no inverse matrix?
Thank you.
I attached a picture with the VI.
-
Great info. Ok, so now I know I can use Linux for what I need. The bosses don't seem to interested in getting an academic license right now.
This driver is listed as an IVI driver. IVI drivers require some lower level OS specific software. There MAY be IVI drivers for Linux, but you should look for plug-and-play drivers for your instruments.These are basically VIs that can be loaded on any platform. You can also customize the driver; IVI interfaces are typically DLLs and you can't "see inside". Given a choice, plug-and-play drivers are the way to go :thumbup:
your tkdpo4k has a plug-and-play driver located here
-
Thank you for the valuable information.
I am using the drivers I could found in the Driver Network in National Instruments (http://www.ni.com/devzone/idnet/). The drivers here are not specified to be for Win or Lin. This means they are for both?
Right now the ones being used are the drivers for the Tektronix DPO4000 osciloscopes (http://sine.ni.com/apps/utf8/niid_web_display.download_page?p_id_guid=0CDA4000E8BC0C3FE0440003BA7CCD71) but I don't know if they are only for Windows. I guess they could be used in Linux as well if they are poster in ni.com. No?
-
Hi!!
I am working in the Institute of Space Studies of Catalonia and we're gonna get a license. Because we mainly have computers with Linux we might get a Linux license. However I am wondering if the 2 versions (Win and Lin) are totally equal or they have any differences?
This questions is mainly toward Linux programmers who might have found any problems that Windows programmers haven't found.
Thank you very much!!


Application builder makes VI's run faster?
in Application Design & Architecture
Posted
QUOTE(yen @ Oct 5 2007, 01:37 PM)
Thanks!
The weird thing is that the labtop now is running faster and I didn't do any change. Anyway I'll try to optimize the VI's.
I'll try your suggestions.