王佳
-
Posts
24 -
Joined
-
Last visited
-
Days Won
1
王佳's Achievements
")


-
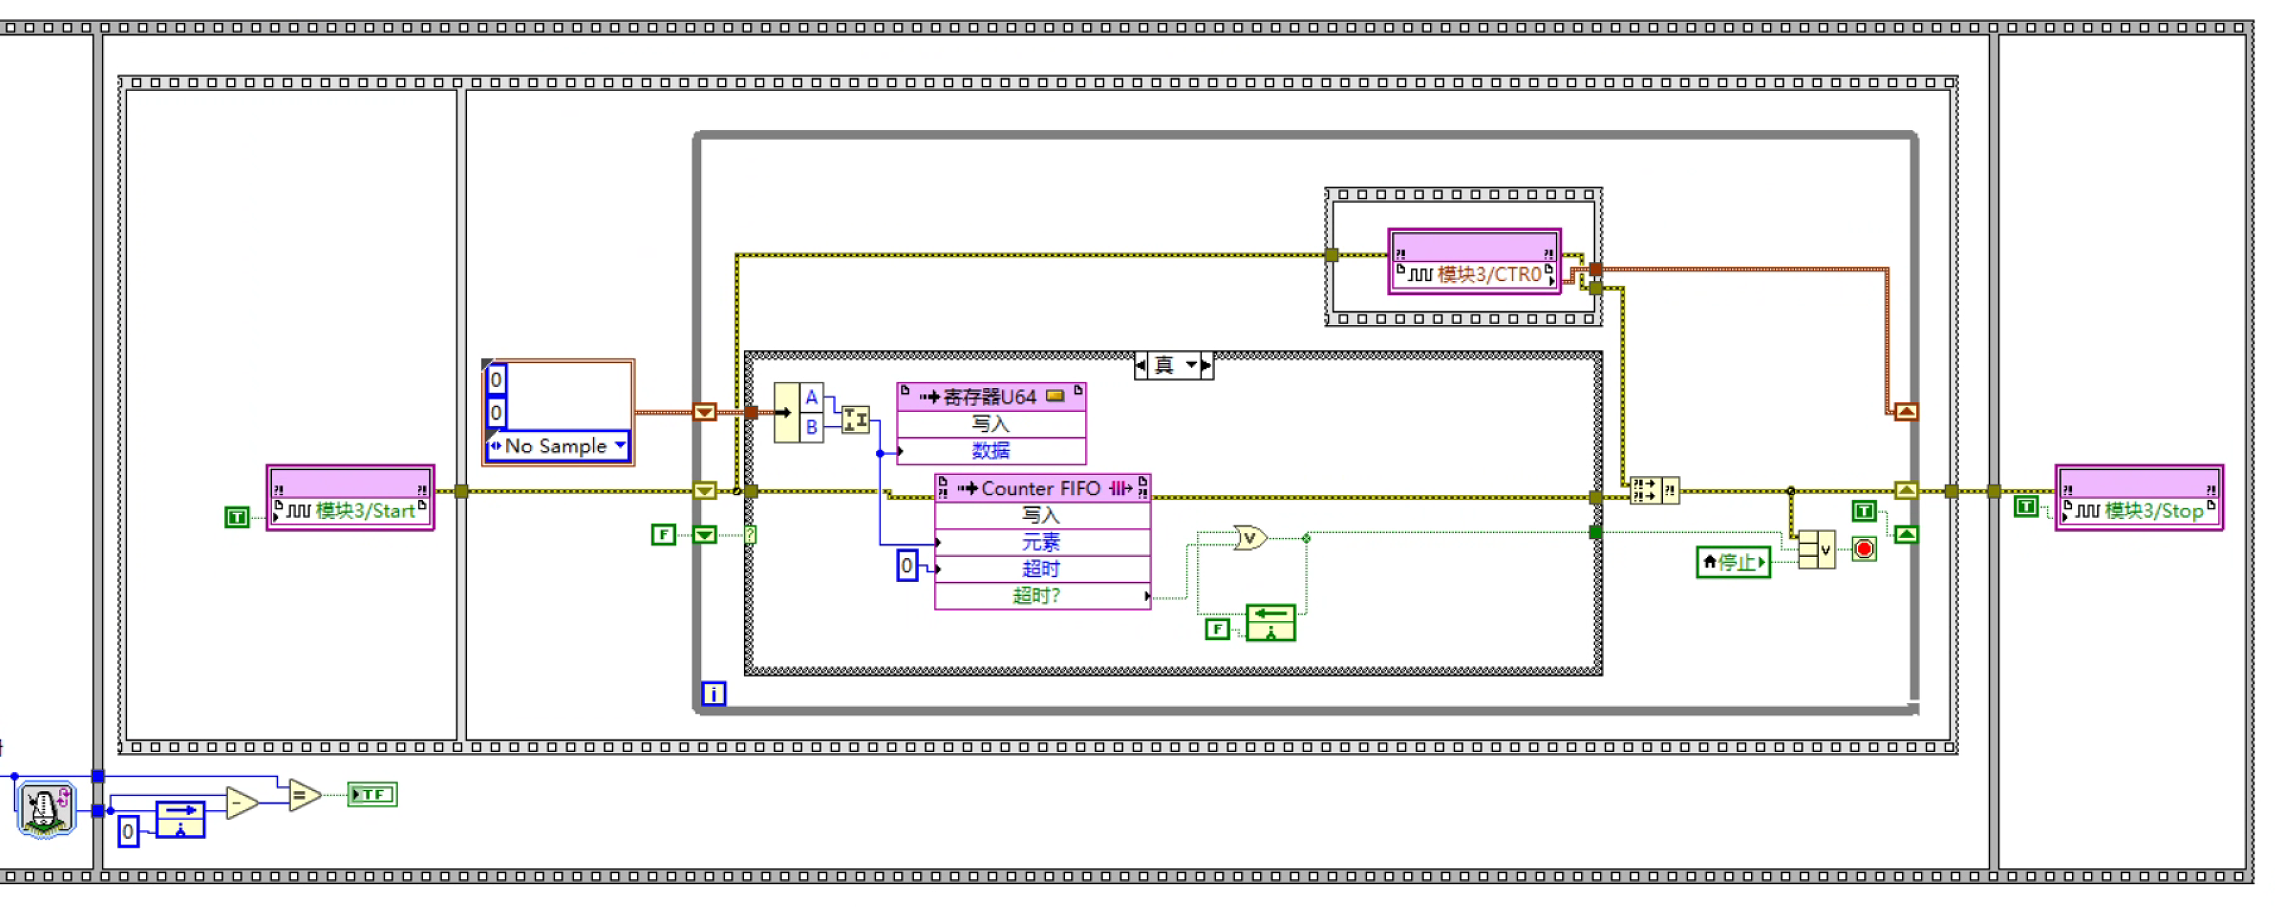
I’d like to ask you about reading quadrature encoder position signals in an FPGA environment using the NI-9361. In X4 mode, I followed the example program to write my code, but I still cannot get any data. I am using a loop timer together with a flat sequence structure to form a timed loop for acquiring the position signal.I’m very sorry that I only have a Chinese version. I hope to get help from everyone!

-
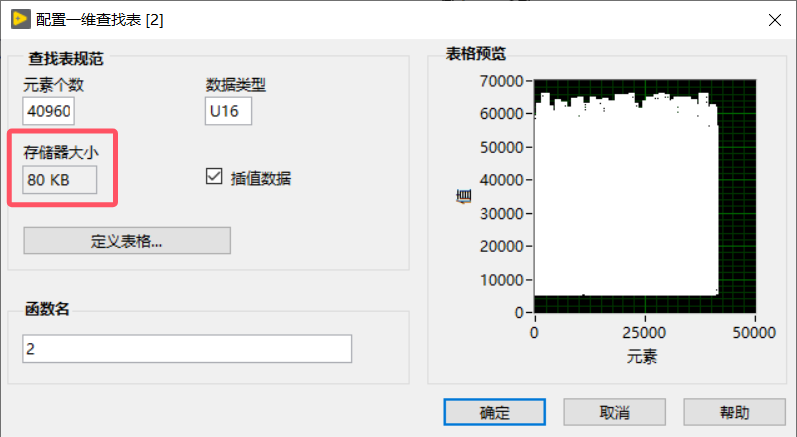
First of all my device is a CRIO-9043. I want to use one dimensional lookup table for interpolation in FPGA.vi, I am using U16 data type and one lookup table can store 40960 data and I need to store 7 million data. Currently I have inserted only 16 tables and the RAM resources are not enough. My compilation tells me that one lookup table takes up 19 RAM resources (my device has a total of 325 RAM resources). But on the lookup table it shows that one table uses only 80KB of storage, while on the official website the CRIO-9043 has a RAM size of 2G! I don't know how to solve this problem. Attached is my program, sorry it's only in Chinese! 15.vi
-
 I have only found this node, named Ni FPGA Discrete Transfer Function Direct vi. Are there other methods to implement a discrete transfer function?
 -
My derived clock only goes as low as 4.69 MHz. My device is CRIO-9043
-
First of all, thank you for your response. I know about SCTL. But that's not what I need.🥰
-
You're right. AI and AO cannot sit in a SCTL. And I don't need to have IO nodes in my loop. I now need a program to implement the equivalent of a timed loop instead of using SCTL directly. SCTL is too fast for me, I may only need 500k.The image I provided for example is an implementation of a timed loop, but it's not as efficient as I thought it would be. I would like to know if there is another way to write it. Anyway, thanks for your reply!
-
I now need to program on a labview FPGA module and I need an efficient way to write a timed loop program. The loop program I'm currently using is shown in the diagram, and it looks like the sampling frequency is only 200k, and I'm aiming for 500k. I know that using User Controlled I/O Sampling Acquire Faster than an I/O Node, but now one of my loops does not involve an I/O Node, and in this loop my program may be too complex to meet the 500k requirement when using the timed loop program as shown. Is there any other way to write a timed loop? Please provide me some help! Thanks!
-
I have only found this node, named Nifpga Discrete Transfer Function Direct.vi, but after inputting the transfer function coefficients, its output doesn't work correctly. I tried the same discrete transfer function on the non-FPGA side, and it worked fine. I am not sure what the issue is. Are there other methods to implement a discrete transfer function?
-
Thank you for your continued help and advice. I'll think about it myself and learn to implement it on FPGA. Thanks!🙂
-
I think I know what I need, but I can't seem to describe it accurately. I'm sorry.😭
-
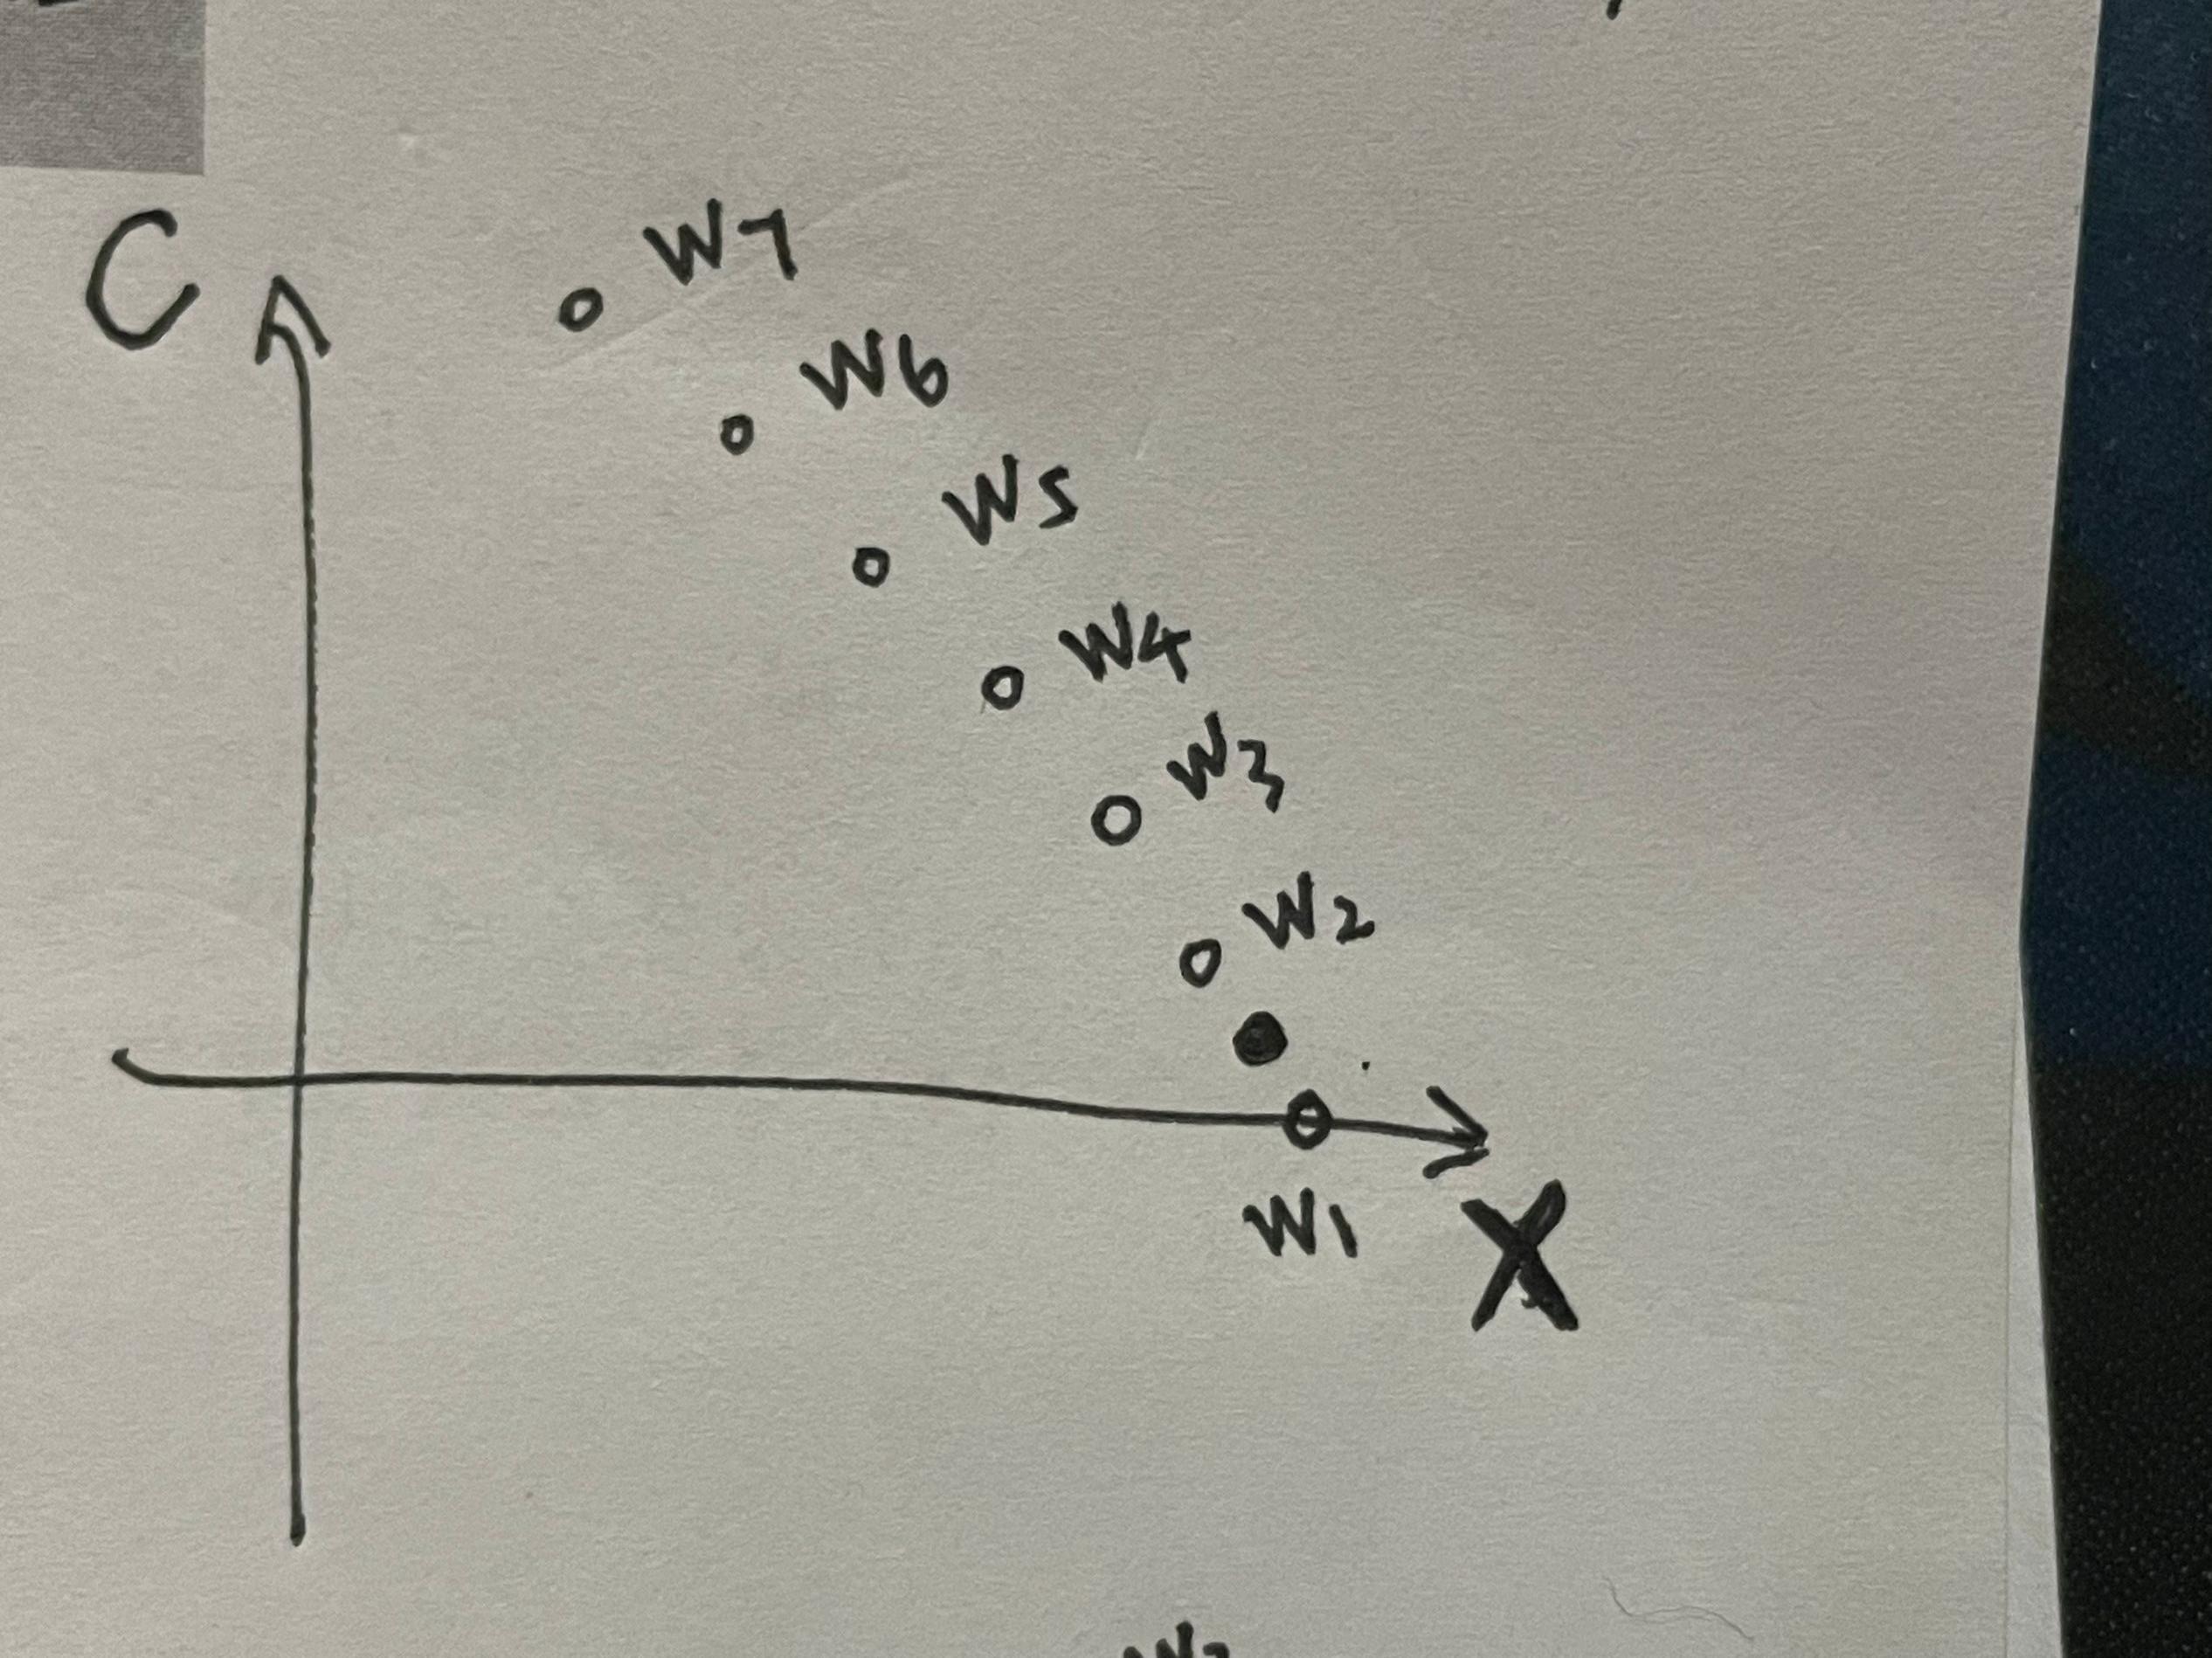
I know about bilinear interpolation. But I don't know how to do it with my lack of data points. The hollow points in the graph are known points and the solid points are the points to be interpolated, (Hollow points don't have some kind of linear relationship) I don't know how to use bilinear interpolation. I am not able to find 4 known points.
-
These graphs are just an example, and sometimes the slope may not be a constant. I would now like to tell you about my idea or need. This kind of graph above is done by planning in advance, I know the correspondence between each group (X,C) and W. I need to read the value of X and C from two encoders to find the corresponding value of W. But since it is ideal, the values of X and C are divided equally, for example, the value of X is 10 and divided into 10 parts, each with an interval of 1, but the values I read from the encoders may be 1.1 or 2.3, 3.5, etc., and the same goes for the value of C! And the values of X and C can't correspond to each other, so I can't just interpolate X or C in one dimension to get W. So I think I should find the corresponding W value by interpolating in two dimensions, but I don't know how to do it. I've only implemented one-dimensional interpolation via lookup tables so far. Anyway, thank you very much for your reply and help!🥳
-
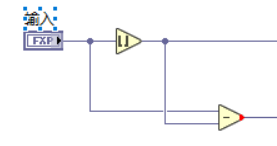
If my requirement does not include the case of negative numbers, can I use the procedure I wrote above.
-
I seem to have implemented this feature. Using the module round toward-infinity. That should do it, right?🤨