Search the Community
Showing results for tags 'debugging'.
Found 5 results
-
 The TL;DR is in bold. I want to add to the Conditional Disable structure a new built-in symbol that toggles when the VI's "Debug Enabled" setting is toggled. I've wanted this for a long time, but I finally got around to opening up the code to see what's possible. Let me take care of one question right away: I have no idea what version of LabVIEW this might or might not go into. So don't get excited. :-) Anyway... it turns out, what I'd like to do isn't straightforward. All existing conditional disable symbols are global to the application instance. The three built-in symbols -- bitness, target, and run-time engine -- are universal to the running environment. The symbols that users can define are in the project and target. In other words, if I want to know the value of any symbol, I just need the reference to the application instance, not to a particular VI. And, guess what, all the C++ code is therefore oriented around application refnums not VI refnums. *sigh* Now, it turns out that I can see a way to add the debug-enabled flag in a sort of sideways manner, and I would just hardcode that symbol as a special case in some parts of the code. RED FLAG! Alert! Developer has used the phrase "special case"! One of my colleagues likes to refer to the "0, 1, Infinity Rule". That is, there are either zero cases of something, one case of something, or an infinite cases of something. There's never just 2. Or 3. Or any other finite number. Basically, as soon as you are prepping the second special case, your code needs to be architected to accept an infinite number of such special cases because otherwise, you're going to build up a huge number of unmaintainable hacks over time. If there really is just one special case, then the code generally remains maintainable. One special case isn't a hack... it's just the special case of the problem you're code is solving. The second special case is a hack. I try to avoid hacking up the LV code base and developing more stuff that needs refactoring in the long-term, so I'm hesitating about working on this feature. With this in mind, I went to a couple of other dev and asked a question, and I want to ask the LAVA community the same question: Besides "enable debugging," are there any other VI-specific settings that would cause you to want to change the actual code compiled into the block diagram? I honestly cannot think of any. Reentrancy? I don't typically change the reentrancy of a VI on a regular basis. A VI is either designed to be reentrant or not... flipping that switch usually changes how the node is used entirely. Thread affinity? I can't think of any VI where I have ever wanted to sometimes have the VI in UI thread and sometimes have it in Exec System One, and where I wanted different code in those cases. No one else I've asked has been able to come up with any scenarios for that sort of thing either. Oh, the hypothetical COULD exist, but hypothetically, I could want the font on all my numeric controls to become italic whenever the VI is set to "run when opened". It ain't a real use case. :-) One person suggested that there might not be VI-property-related settings that would want to change out code on the diagram, but maybe there is a case for user-defined symbols at the VI level? Maybe. But, honestly, the Diagram Disable structure pretty much covers the "I want to change out the behavior of this VI". Yes, we all know cases where we have code on the left half of the screen and code on the right-half of the screen, and we need a separate disable structure around those regions... but that's just as probable as having that right-side of the screen dropped into a subVI. The setting then is not a per-VI setting, but it is either a per-project setting (which we have today) or a per-library setting... and that I can easily imagine a use case for. Having a per-VI user-defined setting just seems problematic if you dropped the code into a subVI and lost the link between those two VIs. I hate adding any feature that discourages people from creating subVIs as needed! So I'm rejecting that use case. And the library use case, while a good one, is outside the scope of what I'm asking about today. Go put it on the Idea Exchange if you want to promote it. :-) Which brings me back to the "debug enabled" setting. That setting can be programmatically toggled when doing a build (if you go into the custom per-item settings because NI doesn't have an easy single-checkbox for you) and frequently we do things while debugging that would just slow down a release build. Which means it makes sense to write code into the VI that could be either compiled in or compiled out based on the VI's debug settting, unlike any of the other settings. So... brainstorms anyone? And please be honest. Even if you want this specific feature, and you think, "Well, if I present this valid use case, it means he won't put in his hack, so I'm cutting my own throat," trust me... for the long-haul, you'd rather LV develop as cleanly as possible, for the sake of your own trust in it!
 -
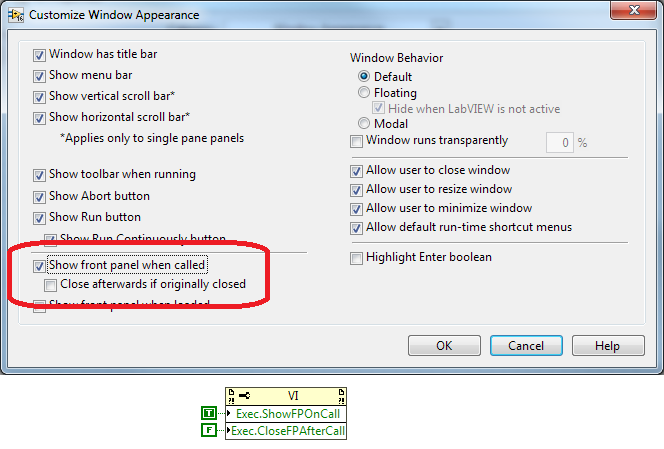
Giant VI hierarchy. Runs for some long amount of time. Somewhere in the mess, a value is generated that is causing the program to go awry. You only know about it at the point where the program goes wrong, which appears to be a long way from where the value was generated. Your challenge: Find the VI that is generating that value and make it generate some other value. I've had to debug things like this in LabVIEW before... I just tried something that worked surprisingly well. It works if the value to be generated is somewhat unique in your application (i.e. a particular string or a particular double value... doesn't work so well for common values like "1" that may occur a lot in your application). Steps: Run a quick bit of scripting to change all of your VIs to enable "Show front panel when called" and disable "Close afterwards if originally closed". See picture. Run your top-level VI. Set a breakpoint in the subVI where things are going wrong -- which you know has to be after the value is generated. (optional) Abort the VI hierarchy. This just cuts down on other stuff happening in the system. Now you can use ctrl+F and do a text find for the value. Because all the panels were open, the value they last emitted is on their panels. Even if it is nested inside an array of cluster of array of cluster of... etc. Even if it eventually got packaged into a DVR or passed through some other data-passing mechanism, the original VI that generated the value will still have the value on its panel unless that VI has been called again for some other purpose. This does slow down your whole application -- having the panel open makes LV spend a lot of time updating the controls and indicators, which is a lot more data copies. But at least in my most recent case, this strategy was effective. I figured I'd pass it along. By using the "Show front panel when called" option, you get all the reentrant clone VIs, which you won't get if you just open all of the source VIs in your project.

-
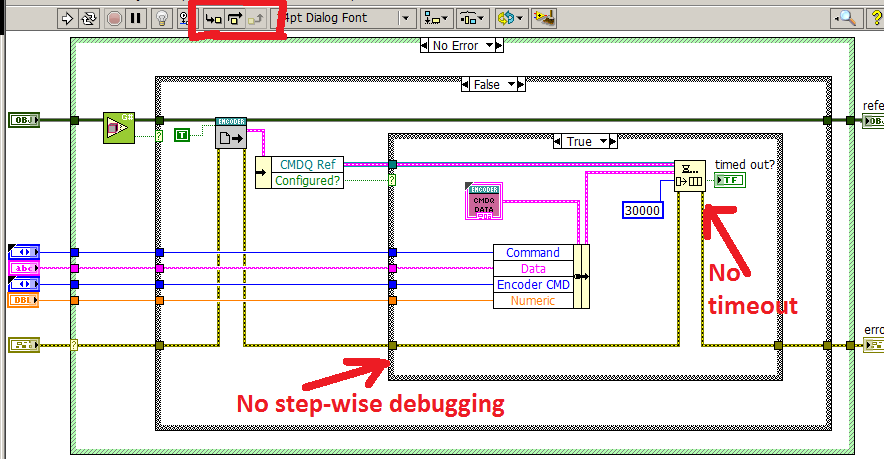
 Hi all, I got a strange queue behavior that is probably related to race conditions. The problem is eliminated (a way around is found), so there is no need in a quick solution. However, I would be happy to understand reasons for such a phenomenon. BD of the “problematic†VI is attached. The queue size is limited to 1. The program consists of multiple asynchronous processes. Execution reaches the Enqueue Element node than stops. The timeout never happens; the program hangs. However, there is more. If I try to execute the VI step-wise, everything works fine until the execution enters the internal Case Structure. When it enters, three Stepping buttons become disabled. If I try to decompose the program, i.e. to use the same VI in a simple single-process program, both problems disappear. Have you encountered such a strange behavior? Any ideas that can help to the poor creature (me) to avoid sleepless nights?
-
Hi all, Have you ever tried to debug a large application and wished that you could quickly retain wire values on all VIs in the main application so you could find your problem with data etc? I would love to have a function where I could quickly toggle the "Retain Wire Values" button on all my subvis (ideally also be able to choose how many levels I do this down the hierarchy). My colleague and I have searched for a property node or a method in the scripting functions but have not found anything other than "Highlight Execution" setting. Is this a hidden feature or have we just not looked hard enough. This question was asked by others back in 2009 : http://forums.ni.com/t5/LabVIEW-Idea-Exchange/Enable-Retain-Wire-Values-for-entire-VI-hierarchy/idi-p/1045552 Vishal Devanath came up with a JKI RCF vi to do this back then but this no longer seems to work (at least in LabVIEW 2012). Any ideas? P "Give a man a fish, and he will live for a day. Teach him to program LabVIEW™ and he wont need fish again" Confucius cira 480BCE
- 33 replies
-
- 1
-

-
- block diagram
- retain wire values
- (and 1 more)
-
I recently spent some time describing a logging tool that we use here at DMC that has significantly reduced our debug times and helped a lot with onsite support and I thought it was worth bringing it up to the LabVIEW community. Essentially, it's a logging utility based off of NLog that allows the user to add the equivalent of print statements to their code - any string that can be built is fair game. It also allows a logging level to be associated with the print statement and this is the concept that makes it extremely powerful. Some statements can be low-level "trace" statements, while others are "warnings" or "errors". During run-time (even in an executable) the level of the logger can be changed and you can easily do trace-level debugging for a glitch, and then set it back to an informational level afterwards. Multiple targets are supported, including RT console, log files, TCP/UDP streams, and email. All the calls are made asynchronously, so the debug statements have a minimal impact on the code execution. At this point we are finishing and polishing the implementation, but more information and details can be found in a blog post I recently wrote: NLog for LabVIEW: Logging done properly -Jody Koplo