Search the Community
Showing results for tags 'vpl'.
Found 1 result
-
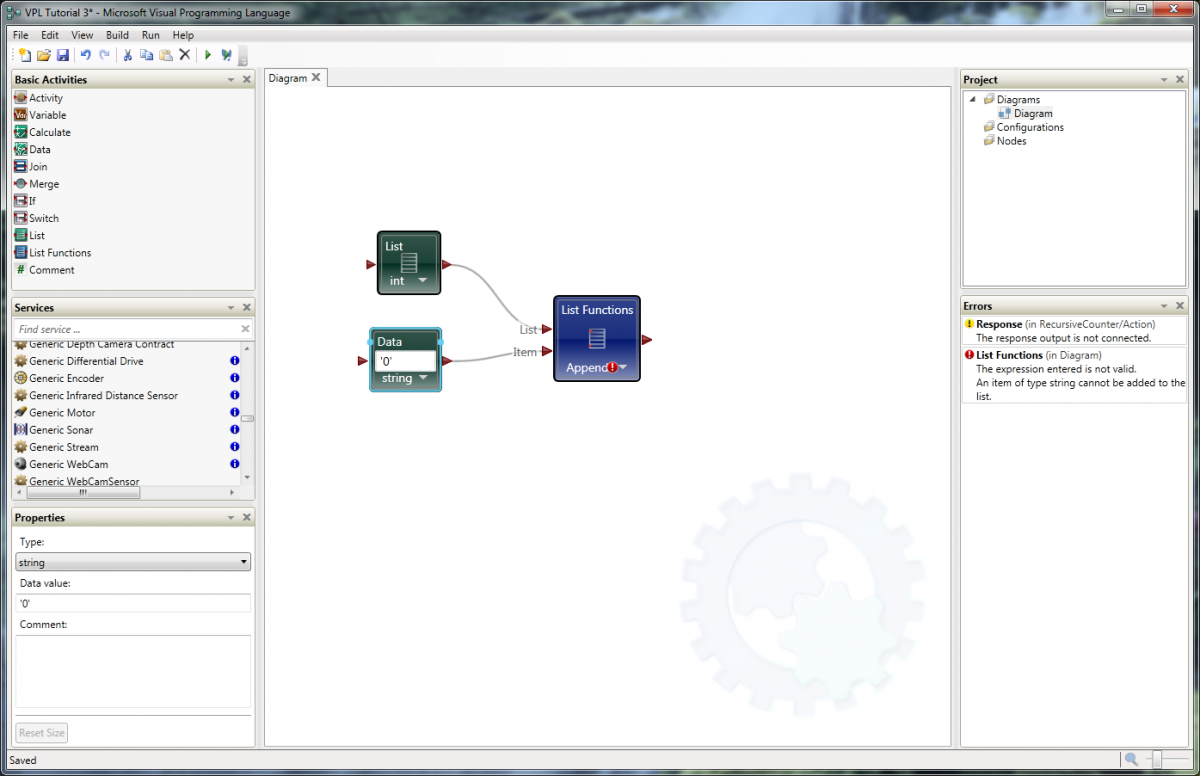
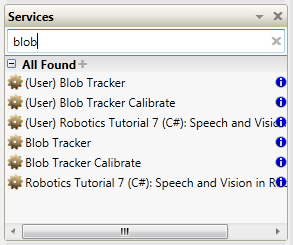
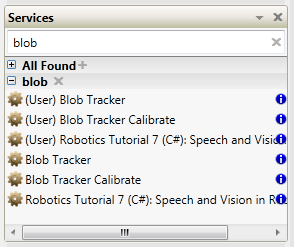
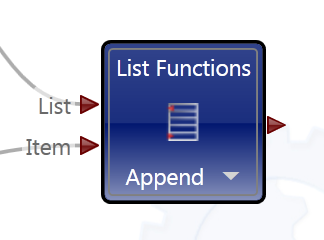
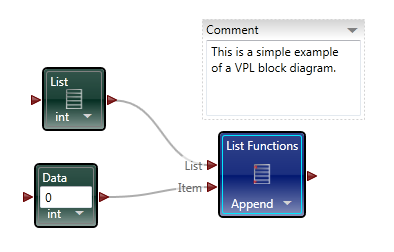
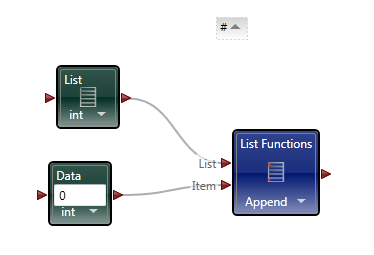
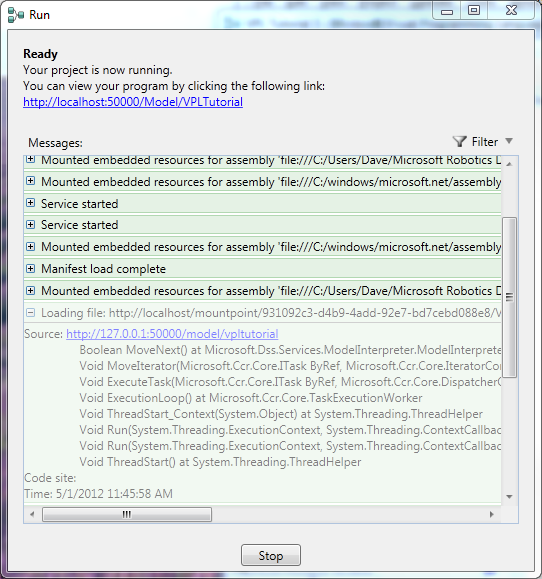
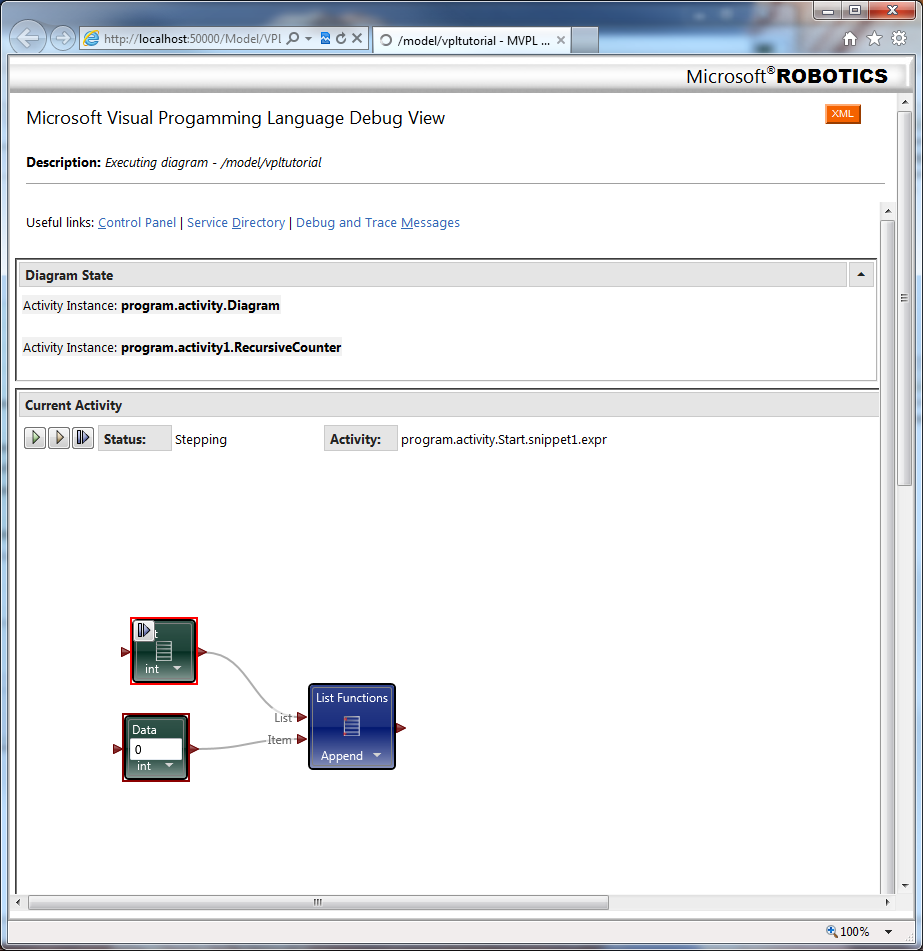
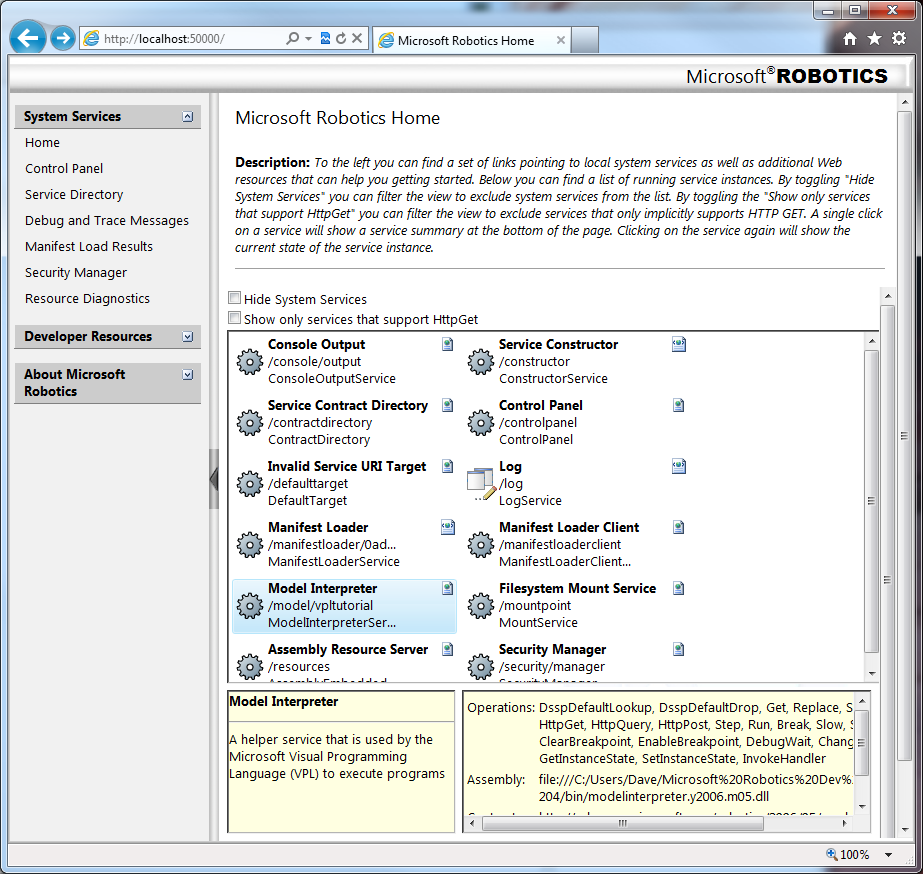
 Recently I've been looking around at other dataflow languages, primarily because I'm curious to see how G's language design influences the way we think about dataflow. Last week I downloaded and installed Microsoft's Visual Programming Language, a dataflow language included as part of their Robotics Development Studio. On the surface VPL appears to be a direct competitor to Labview. If that concerns you, don't worry... imo VPL has a long ways to go before it can offer the simple workflow and overall ease of use as Labview. In fact, when Robotic Studio was first released MS did not publicly consider it a competitor to Labview. Still, it has interesting features that may (or may not) be useful in a Labview context. This post is not intended to be a criticism of Labview or question NI's design decisions surrounding the language and IDE. It's just pointing out a few of the differences and my reaction to them. The IDE The very first thing to notice is the MDI (multi-document interface -- docked windows) IDE. In my opinion Microsoft does a very good job creating developer-friendly IDEs. The VPL IDE, though sparse, has the look and feel many text language developers are used to. Although we've learned to accept it, Labview's window management can be a pain sometimes and it was refreshing to work in an environment where that wasn't a concern. The Basic Activities and Services palettes contain all the components I can use on the block diagram. The Project and Errors window are always visible, making it more convenient for me to use those features. The project window doesn't contain all the information I would expect it to and in fact some parts of my project can be difficult to get to. In particular, in this project I have a custom activity--roughly analagous to a LV sub vi--and the only way I've been able to get to that block diagram is through the error window. I can't say whether this is an oversight in the IDE design or me not fully understanding the programming model. In the diagram above I'm trying to add a string to an integer list, which is a type mismatch error. Selecting the List Functions error from the error list causes the corresponding error icon to throb, drawing the developer's attention to it. Does VPL's error highlighting provide better usability than LV's error highlighting? Not really, but having worked in LV's visually static environment for so long there was a certain amount of juvenile delight in seeing dynamic graphics on the block diagram. The Properties window shows the properties of the selected block diagram item. I'd love to have a similar feature in LV. LV's modal properties dialog box feels antiquated and clunky in comparison. To be fair, a sub vi has far more properties than any of the VPL nodes I used, so presenting all that information to the user is not a trivial challenge. The Services palette offers a search box, similar to LV's palette search, but extends it in an interesting and useful way. It is possible to save the search results in a custom palette group. For example, if I type in 'blob' the palette shows all the related services. Clicking on the '+' symbol creates a new grouping named 'blob,' making it very easy for me to locate commonly used palette items. I expect groups would be created and destroyed frequently during a development session. Also noteworthy is the blue information icons on the palette. Clicking on the icon opens the help associated help page in a browser. It seems insignificant, but it is more natural than LV's process of hovering over the sub vi and mousing over to the context help window to click the link. For reasons I'll explain later, in VPL visible pin labels are more important to readability than they are in LV. I like how MS has made them less obtrusive. The label is translucent, not transparent. Wires passing under a label are dimmed somewhat instead of completely obscured, preserving the visual connection while retaining readability. I've often wished for better transparency support in LV. VPL includes comment blocks, which are similar to free labels. Comment blocks have the added features of being collapsable and having scrollbars when they are needed. These are features I'd love to see ported to Labview. Oddly, comment blocks do not offer a word wrap option, something they would definitely benefit from. The IDE also offers something many LV users have lobbied for and equally many LV users have lobbied against: block diagram zoom. Insert religious war here. Debugging Running a program from the dev environment gives us some insight into what is going on under the hood with VPL. A dialog box opens telling me my project is running with a list of messages. As you can see from the image below, even simple programs have some pretty significant stuff behind them. If your program isn't behaving as expected, errors will show up here. In typical Microsoft fashion, there is an abundance of cryptic information to sift through. While perhaps intimidating for new users, I'm certain it would be very useful in the hands of experienced developers. I haven't decided if I like VPL's debugging features or not. It's very different from anything I've used in the past. For starters, the debug environment is presented in a browser window. Current Activity highlights the next step to execute in the block diagram and provides controls for single steps, running, and setting break points (not shown), but the block diagram is just an image; there's no interactivity with any of the elements. You cannot probe a wire to see what value was sent. VPL offers a "Log" service you need to add to the block diagram instead. One nice thing LV does that VPL does not is execution highlighting. In VPL's debugging view the execution jumps from node to node. The ommission makes it harder to follow the data flow--especially for LV developers--because VPL's concept of dataflow on the block diagram is very different from LV's interpretation. (More on this later.) In these ways VPL's debugging features feel very primitive compared to those available in LV. On the other hand, near the top of the debug window are links to the control panel. I haven't used VPL enough to understand how useful it is in a real application. In general I prefer too much information over not enough, and the control panel contains a lot of information. There are certainly times I've wanted more visibility into LV's inner workings to help troubleshoot a problem. I didn't even get to the parts I really wanted to talk about--activities, merge nodes, notifier pins, and the differences in data flow models. I'll post a followup covering those topics in the near future.