

Michael Malak
-
Posts
18 -
Joined
-
Last visited
Content Type
Profiles
Forums
Downloads
Gallery
Posts posted by Michael Malak
-
-
-
QUOTE (Jaromir Ludwin @ May 27 2009, 06:26 AM)
Yes, but how did you get Width and Height to be writeable properties? On my LabVIEW 8.2.1, the option "Change to Write" is grayed out. And the help for GObject Bounds:Height says "No" for "Settable when the VI is running".
-
I'm trying to resize a Waveform Graph at runtime (as the main front panel is resized, in response to the Resize event), and I'm starting to think it's impossible. I see that the GObject Width and Height properties are read-only.
The "VI Properties->Window Size->Scale all objects on front panel as window resizes" does not produce acceptable results because if the user shrinks a window to be small and then enlarges it again, buttons, text, etc. start to overlap because they do not return to their original positions. I tried to protect sub-areas of the panel by putting them (e.g. aligned buttons) into tabs, but that automatic "scale all objects" evidently does a deep search to resize and does not respect tabs as protection.
I thought maybe I could utilize a splitter since the splitter seems to have nice resizing capabilities, but I then wanted to make the splitter invisible (to invoke it only at run-time) but that seemed to be impossible.
How can I intelligently rearrange VIs on my front panel, in order to accommodate different screen resolutions?
-
QUOTE (normandinf @ May 23 2009, 06:52 AM)
The XY Graph is polymorphic. If you wire a different datatype in a VI, it's gonna change datatype to adapt. But if you use a reference, the datatype needs to be matched to the one in the VI where you got your reference from. Be careful with this because once you've created your reference and used it elsewhere in your program, you have a lot of broken arrows or error pop-ups (if value is a variant) if you ever change the datatype of your graph...That was it!
I deleted my XY Graph, placed a new one, and wired in the data generation from the LabVIEW example code for multiple plots. Then I created a new reference from that and deleted the data generation code.
Thanks for the help.
-
Plotting multiple plots to a single XY Graph is easy enough when the XY Graph is in the same VI -- thanks to the Multi Plot example that comes with LabVIEW. Specifically, create a 1-D array of clusters of a 1-D array of (x,y) points/clusters. This can connect directly to an actual XY Graph.
But all I have is a reference to an XY Graph. When I select the "Value" property, it won't accept multiple plots. It will only accept a single plot.
What property(ies) should I be using to plot multiple plots on an XY graph?
-
QUOTE (Neville D @ May 14 2009, 03:32 PM)
I should have mentioned that it was what I decided upon at the end of this thread:
http://forums.lavag.org/Instantiate-WaveGr...aded#entry62912
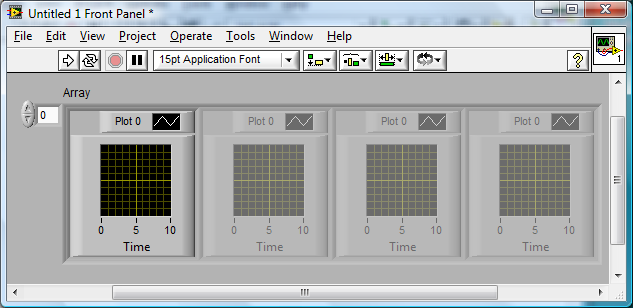
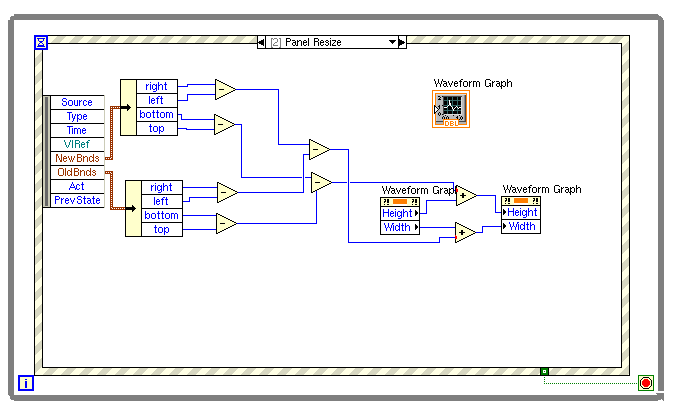
In a nutshell, I need 12 WaveGraphs, independently controlled (including zoom), yet treatable as an array. So I am using an array of 12 references to 12 independent WaveGraphs. The attached diagram shows my current solution, which is to wire the array of references directly to where it is needed in the event loop.
-
OK, so now I've decided to have an array of references to 12 WaveGraphs. And it works. For the sake of keeping the diagram clean, I would like to separate the initialization of this array from the use of the array. But when I right-click on the output of the Build Array VI, the option "Create Local Variable" is not available.
Is there an alternative to wiring the array directly to where it is being used, or is there some way I can separate my initialization code from my event-handling code?
-
QUOTE (mross @ May 13 2009, 03:34 PM)
You can't "dynamically instantiate" anything without scripting, and that is not where you want to go. We are trying to offer you solutions not pipe dreams.Did you try a tab control? You can put graphs on different tabs and programmatically cause different tab pages to be visible.
Or with much more trouble you can move the locations of the various graphs so they are visible on screen, or they are off screen. If you try to manage that with 64 individual graphs you are in for a long, boring job that will be of limited use to the user.
I gave you a way to show absolutely any combination of the 64 plots overlaid in the same graph. Use that and your work is almost done. You could decide that realistically only 4 or 6 graphs provide useful visual information on screen at the same time, and give the user the ability to show any of the plots in any of those graphs.
Mike
Thanks for the info on instantiation. I had guessed that perhaps it might be possible with the "Open VI Reference" VI, but I guess now that that's not the case.
Manually placing N WaveGraphs (12 is all I need immediately for the next month) and then placing references to them in an array is the approach I'm going to take to achieve simultaneously the programming convenience of arrays and independent properties (such as zoom) in the WaveGraphs. I'll simulate instantiation via the "Visible" property of each WaveGraph.
-
QUOTE (normandinf @ May 12 2009, 05:13 PM)
1- It's a writable property and it's the right one to adjust programmatically the number of array columns. I tried and it works.2- You don't get an array of one element, you get a cluster of one element. Remember that you had to put the XY Graph in a cluster to display as array of graphs.
As a side note, you have to realize that this implementation does not allow you to change the color or point style of graphs independantly. If you change it on one graph, it gets changed for all elements in the array... That's because the array element reference doesn't return value of all elements but rather is a reference to the datatype of the model element. Thus, any property you change on one graph, whether it is manually (on front panel) or programmatically, you'll see changes in all graphs. That could be great for plot color, but it won't be cool for axis scaling, zooming, etc.
The inability to independently specify zoom would indeed be a bummer, which leads me to my original question this thread (which still hasn't been answered): how to dynamically instantiate a WaveGraph?
-
QUOTE (ShaunR @ May 11 2009, 03:53 PM)
You used to be able to put graphs directly into arrays.I don't think you can anymore. But you can do this......http://lavag.org/old_files/monthly_05_2009/post-15232-1242078686.png' target="_blank">
Put your graph into a cluster. Then put the cluster into an array.
OK. How can I change the size of the control array at run-time? The Array Property Node "NumCols" seems to be read-only.
UPDATE: Never mind -- I discovered "Make write-only" on the Property Node.
-
QUOTE (Mark Yedinak @ May 11 2009, 04:46 PM)
You could but I would agree with mross. You need to think of what the user truly wants and design a user interface that meets those needs. Your suggestion while functional is actually looks rather unprofessional. Depending on the target audience this solution simply wouldn't do.I probably should have also included up front that I have 2-3 decades of non-LabVIEW experience and that the requirements for this project are well-defined and set in stone due to the existence of a previous application lineage with the same use interface in continuous use for the past 15 years.
The suggested solution of an array of clusters of WaveGraphs is probably going to work for me, and actually answers directly the previous question I asked on the User Interface subforum here, which is why could I create an array of toggles, a cluster of WaveGraphs, but not an array of WaveGraphs.
-
The number of graphs does need to be determined at run-time, depending upon how many channels are in the file being read in (will be in the range 1 to 64). Now my question is how to dynamically instantiate WaveGraphs using "Open VI Reference". I've just now asked this separately in a new thread in the Application Design & Architecture subtopic.
-
I am new to LabVIEW.
I am trying to read in a file that has N channels, where N is somewhere between 1 and 64. I need to display each channel in its own graph (overlapping is not acceptable to the users). Thus, I would like to dynamically instantiate at run-time N instances of WaveGraph. How do I do this?
I see that there is a VI called "Open VI Reference", but it requires as input what seems to me to be a physical path to the VI source. How can I use "Open VI Reference" to a built-in VI such as WaveGraph? And is there anything else I need to do to get it to be displayed on my VI's front panel?
-
QUOTE (normandinf @ May 11 2009, 11:15 AM)
Waveform graphs are polymorphic indicators. You can bundle signals or make arrays of them and wire it to a single wavegraph indicator.Use the plot legend to see all traces on the same graph.
My users demand separate waveforms on separate plots (e.g. eight channels in a 2x4 arrangement of plots), even when this makes each plot tiny.
-
I am new to LabVIEW.
On a VI front panel, it seems that I can create an array of toggles or a cluster of WaveGraphs, but that I cannot create an array of WaveGraphs. Is this a known limitation, and if so, is it documented somewhere and is there a rationale for it?
-
You guys did such a great job answering my first question
http://forums.lavag.org/Newbie-Q-Writing-t...ols-t13762.html
now on to the second.
Is there a way to define ALT-key keyboard shortcuts on drop-down menus? E.g., have the "F" in "File" underlined and where the File menu drops down when the user presses ALT-F? The "shortcut" field in the Run-Time Menu editor seems to be for CTRL-style keyboard accelerators (e.g. "CTRL-C" for Edit->Copy). And the run-time Insert Menu Item VI doesn't seem to allow either style of keyboard shortcuts to be defined.
-
30 years software development experience, but new to LabVIEW.
The control/indicator dichotomy has me flummoxed. I would like to programmatically set the default values of user input controls. Is this possible? I'd like to have a "setup" dialog or window populated with controls, where the user can select a file containing a "setup" that populates the controls with the settings from that setup file, and then the user can fine-tune the values in the controls. How can this be done?
Scaling a BMP
in Machine Vision and Imaging
Posted
I'm reading in a BMP, converting it to a pixmap, and making it the background image to an XY graph. Is there a way in LabVIEW to scale a pixmap, or do I have to write my own image scaling code?