Mechatroner
-
Posts
17 -
Joined
-
Last visited
-
Days Won
2
Mechatroner's Achievements
")


-
hooovah, smithd and Dirk - Thanks to each of you for looking this over. I've also repeated this behavior when the error cluster is replaced with a boolean in LabVIEW 2014 32-bit on Windows 8.1 This suggests that the issue is not related to the use of the error cluster but is more of a compiler problem. Dirk - I think the optimizer must be making the same decision in the first while loop. Another oddity is that in my actual application, the error cluster passes through several real VIs in the equivalent of the demo VI Loop 1. I completely agree. Even though there are easy workarounds to this issue, the idea that dataflow seems to not define execution order 100% of the time is a bit disturbing to me. As Dirk suggested to me off-line, I will submit a bug report to NI. I'll post any updates on this issue here. EDIT - jacobson beat me to submitting the bug report. Thanks for your help and prompt attention to this matter jacobson. -John Bergmans
-
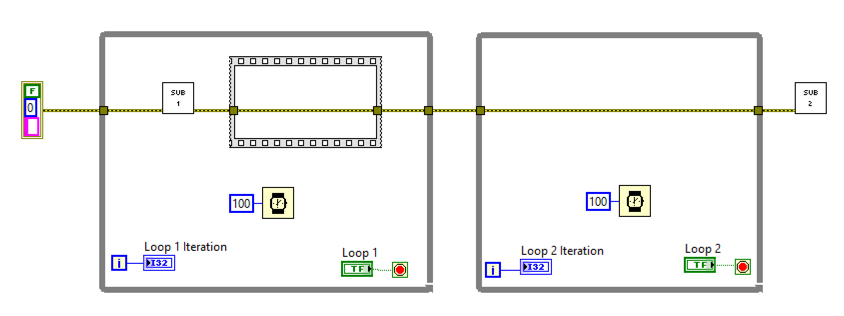
Hi. I’ve discovered what appears to me to be a quirk in the behavior of dataflow in LabVIEW. This discovery occurred while working on an application that contains a main while loop and housekeeping code that runs after the main while loop. I’m enforcing the order of execution in the VI by wiring the error cluster through the main while loop and over to the housekeeping code. Attached is a zip file containing a VI that reduces the application to its key components. The VI contains two while loops connected by an error cluster. The cluster passes through a subvi and sequence structure in the first loop, then passes through the second while loop and finally enters another subvi. A screenshot of the VI block diagram is also attached. When the VI execution property “Allow debugging” is selected, the VI operates as expected - the second loop will not start until the first loop stops. The quirk occurs when “Allow debugging” is de-selected. In this case, both loops begin running as soon as the VI starts! For some reason, the two subvis and the sequence structure are required to make this phenomenon occur. This phenomenon also occurs when the sequence structure is replaced with a conditional disable structure. This behavior occurs in at least the following two environments: 1) LabVIEW 2014 32-bit on Windows 8.1 running within Parallels Desktop 11 for Mac 2) LabVIEW 2015 SP1 32-bit on Windows 10 I suspect that the cause of this behavior is that the LabVIEW compiler is trying to optimize the VI performance by noticing that the second loop and second subvi are not dependent on any data generated in the first while loop. If this is the case, it’s great that the compiler is trying to improve VI performance; however, what’s not so great is i) this demo VI shows that the error cluster does not always enforce order of execution, and ii) a change in the "Allow debugging" setting can change the behavior of a VI without any indication to the developer. This apparent quirk raises two questions: - Are there other situations where the dataflow paradigm does not behave as expected? - Are there any tools available to find out about changes that LabVIEW implements behind the scenes that could cause this or other unexpected behaviors? A short video demonstrating this issue is available here: http://www.screencast.com/t/D3mCCqFyz Any thoughts on this issue would be much appreciated. -John Bergmans Data Flow Test.zip_remove_me

-
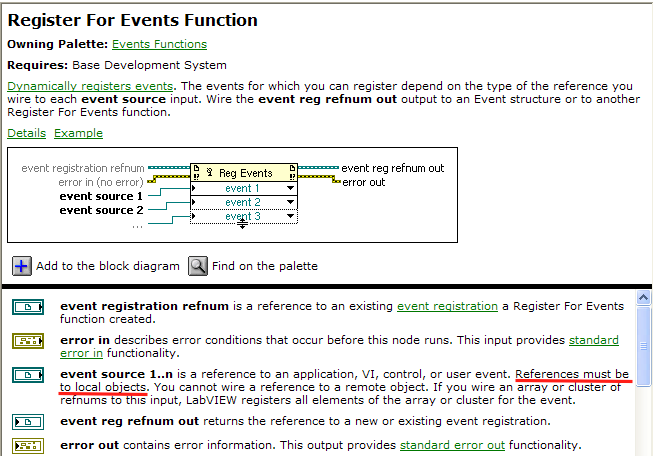
Occasionally, I find the conciseness of the LabVIEW documentation a bit lacking. Here's an example that I would appreciate some assistance with. As shown in the screenshot below, the documentation for the "Register for Events" function states that the event source reference must be to a "local object" and not a "remote object". I'm assuming that: the term "object" here refers to an "application, VI, control or user event"; "local" means on the same physical platform as that on which the Register for Events function is located; and, "remote" means on a separate physical platform from the platform on which the Register for Events function is located. Can anyone confirm these assumptions, or better yet, point me to NI documentation that defines these terms? Thanks in advance for any help you can provide. (PS - The screenshot below is from LabVIEW 2012, but LabVIEW 2013 has the same description) -John Bergmans
-
 LabSocket Application Example Engineering students at the British University in Egypt recently used LabVIEW and LabSocket for a Smart Home Hazards Monitoring project. In this application, the high-level LabVIEW home monitoring software was accessed remotely from a number of devices, including an iPad. A YouTube video, a Prezi presentation and the student's well-written final report are all available on the LinkedIn LabSocket User Group page: http://lnkd.in/bnHxWzi. This work is a great example of how LabSocket enables LabVIEW applications to be easily accessed over the web. -John
 -
I'm pleased to announce that the LabSocket system is now listed in the LabVIEW Tools Network: http://sine.ni.com/nips/cds/view/p/lang/en/nid/212532 To go along with LVTN listing, the LabSocket website (http://labsocket.com) has received an update and includes a much-improved "Technical Details" section and the latest downloadable evaluation version of LabSocket-Basic. Please let me know if you have any questions or comments. -John
-
I've unfortunately had to cancel the one-day LabSocket Workshop on Feb 10. If anyone is interested in attending such a Workshop or having a private version of the Workshop at your organization, please contact me. Here's a brochure about the event: http://labsocket.com/LabSocket_Workshop.pdf Also, here's a brochure with some information about the LabSocket System, including the new MultiClient version, the proposed MultiTarget version and the new LDAP user-authentication capability: http://labsocket.com/LabSocket_Brochure.pdf -John
-
I'll be presenting a one-day workshop about the LabSocket system at the NI Offices in Santa Clara (Silicon Valley), CA on Feb 10. An overview of the agenda is shown below. The workshop will include several labs to provide attendees with hands-on experience with the system. For more information or to register, please visit: http://www.eventbrite.com/e/labsocket-workshop-tickets-10111462657. Workshop Agenda Overview 1. Theory of Operation 2. LabSocket Basic 3. LabSocket-MultiClient: One Target VI Instance per Browser Client 4. LabSocket-RT: LabSocket for LabVIEW Real-Time Environments 5. LabSocket Server Virtual Machine 6. Integration with Moodle Course Management System 7. User Authentication
-
A quick update - I gave a presentation about the LabSocket system to the Bay Area LabVIEW User Group (BALUG) last week. The slides are available at: https://decibel.ni.com/content/docs/DOC-33131. My impression was that the presentation was well-received by the group. To the BALUG members here that attended my presentation - thanks for coming out to the talk. I found the group was welcoming and quite enthusiastic. NI also did a good job of supplying food and beverages and providing a great space for the meeting. I look forward to coming back to Santa Clara to attend future meetings. -John
-
@ShauwnR I haven't investigated the maximum update rate for collectdViewer, but 2 Hz is actually slightly beyond the limit at which the mobile devices that I've tested can reliably display the collectd data on a continuous basis. This limit isn't due to WebSockets or the RabbitMQ message broker of the system. Instead, I believe that the reason for this limit is due to the way the collectd data is processed in the browser: Every 500 ms, the collectd daemon sends out a stream of updates for each measured parameter of the host platform (eg CPU User, CPU Nice, Memory Used, etc), in random order. On the browser side, the JavaScript code allocates the data in this stream to the correct location in a multi-dimensional array containing the time-series data for each parameter. Once all the parameters for the time step are received, all the plots are redrawn. All of this activity must occur before the next stream of updates is received (ie within 500 ms). For mobile devices, i think that what's happening is that any glitch in the transmission of data over the air throws off the processing of the data stream by the JS code. To increase the reliability of the system when used with mobile devices, additional preprocessor logic could be added on the collectdViewer server which would organize and buffer the data before sending it on to the browser. The polling interval of the collectd daemon is set in a configuration file, so it would be very easy to try decreasing this interval to see if a particular browser and platform combination can process the incoming data stream. I should mention that the system does work very reliably with a Chrome browser on my Mac. Finally, as an aside, have you seen the collectdViewer "Hall of Fame"? http://collectdviewer.com/hall_of_fame.html. These screenshots suggest to me that some interesting insights could be gained by using collectdViewer to monitor the performance of a LabVIEW Real-Time application on a cRIO. @hooovahh Thanks for that info. -John
-
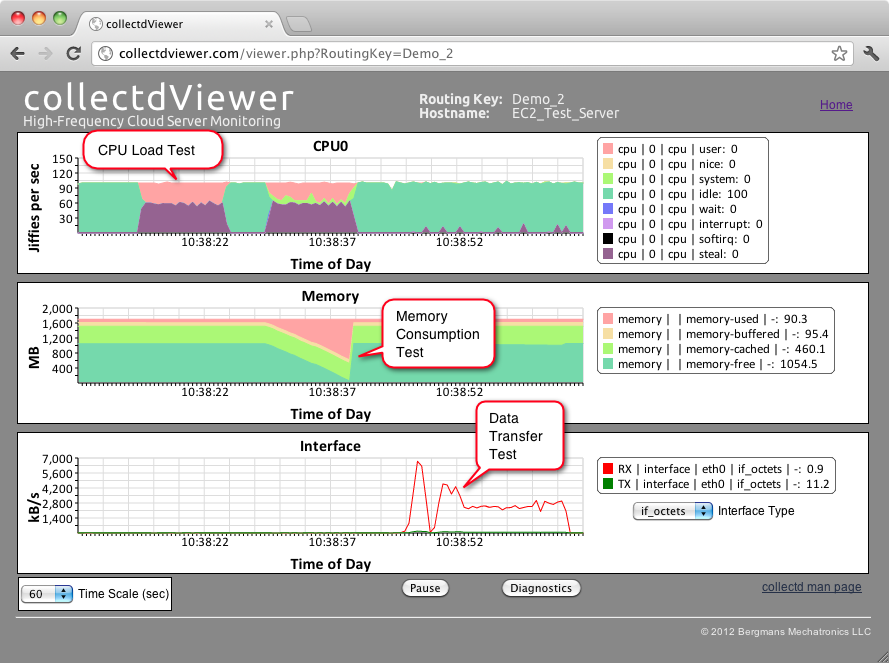
Hello LAVA. Here's an idea for those interested in browser-based monitoring of cRIO-9068 performance. A few years ago I developed the collectdViewer system as a demonstration to the "DevOps" community of the benefits of using WebSockets for server monitoring. Operation of the system is quite simple conceptually: The system uses a collectd daemon (http://collectd.org) to monitor the performance parameters (eg CPU, memory, network activity) of a Linux platform. This performance data is then sent via a message broker and a WebSocket connection to a browser for display. The WebSocket connection to the browser enables a display update rate of 2x per second and as a result, it's possible to observe short transient phenomenon in the behavior of a server. For example, attached is a screenshot of collectdViewer monitoring the performance of an EC2 instance during various system load tests in a 60 second period. The high update rate also make it possible to observe phenomenon such as the network activity associated with serving a single web page or the CPU usage of the login process. Since the cRIO-9068 uses NI's Real-Time Linux operating system, it seems that it should be possible to use collectdViewer for browser-based monitoring of this platform as well. If you'd like to try the system yourself for this application, more information and a downloadable demo are available at: http://collectdviewer.com. Let me know if you need help with setting up the demo system to monitor the performance of your cRIO-9068. A few of other notes: 1) The downloadable demo of the system at the above link uses a message broker hosted on my cloud server. If there's interest in using this system for autonomously monitoring your cRIO-9068, I can create completely standalone systems for a modest fee. These systems would include a Virtual Machine that hosts an HTTP server and message broker and can run on a PC, Mac or Linux platform within your LAN. 2) The video at the following link shows the use of collectdviewer for monitoring and studying the transfer of data from the (recently defunct) Nirvanix Internet File System to an EC2 Server: http://collectdviewer.com/applications.html#monitoring_cloud_storage_data_transfer. 3) It would be feasible to incorporate the display of values of LabVIEW variables in the collectdViewer plots. One way to do this would be to use the STOMP library that I developed for the LabSocket system to send LabVIEW data to the message broker of the collectdViewer system. This idea is somewhat half-baked at this stage, but I thought I'd put it out there in case anyone had an interest in it. Any thoughts or comments are welcome. PS - Apologies for not including live hyperlinks in this post. It appears that the forum editor software is blocking these links for some reason. -John jbergmans // at bergmans // dot com
-
Hi hooovahh. Thanks for taking a look at LabSocket. It's true that there are some minor cosmetic differences in the appearance of elements in the Front Panel and their representation in the browser. My sense is that the current replication fidelity is sufficient for most applications. (I could well be wrong on this point and would be interested to hear about use cases requiring exact replication.) If there is overlap of elements in the browser, you can try shifting the front panel elements in LabVIEW and regenerating the browser representation until the overlap is eliminated. LabSocket does not currently support subpanels, splitters or panes. Also, resizing the front panel does not affect the browser page size. If there is a need for more exact replication in the browser or support for currently unsupported elements, I'd be pleased to tweak the system to meet anyone's specific requirements. -John jbergmans /at/ bergmans dot com
-
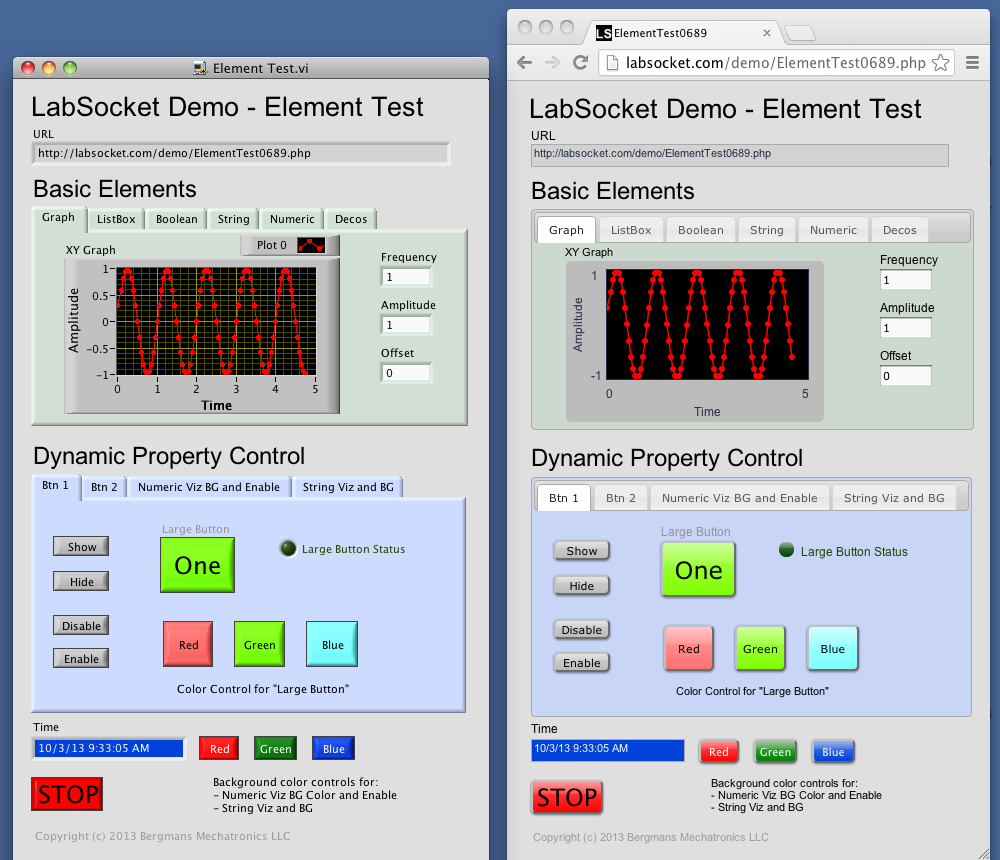
LabSocket enables LabVIEW applications to be easily accessed using a web browser, without the need for browser plug-ins or run-time engine on the client. The latest release of LabSocket includes support for Waveform Graphs and Charts, XY Graphs and MultiColumn ListBoxes. An option to integrate LabSocket with the Moodle CMS is available as well. A detailed User Guide and downloadable demo of this release are at: http://labsocket.com/userguide_demo.html. Below is a screenshot of a test VI (left) and its representation in a browser (right). LabSocket-RT, a special version of LabSocket for the LabVIEW Real-Time environment (eg. cRIO), is also available: http://labsocket.com/RT.html. A live demo of LabSocket-RT operating on a cRIO-9025 can be accessed at http://labsocket.com/Demo2.php, until approximately Oct 4. Other links of possible interest: Documentation on a "Remote Cascade Lab" developed by KTH Royal Institute of Technology in Sweden that uses an earlier version of LabSocket: http://www.energy.kth.se/proj/projects/Remote_labs/RL/RL_website/RCL/RCL.html Screenshots of support for MultiColumn ListBoxes: http://labsocket.com/MCLB.html Presentation to Orange County (CA) LabVIEW User Group Meeting titled "LabSocket System - Plotting Capability and Sample Applications": https://decibel.ni.com/content/docs/DOC-30313 Any questions or feedback about the system are welcome. -John Bergmans
- 10 replies
-
- 2
-

-
- remote control
- automatic web page
- (and 1 more)
-
Thanks for all of your comments. I'm glad to hear that there appear to be no known problems with FG and USRs. It's also been interesting to hear about the different variations of FGs that have been developed. Regards, John Bergmans
-
From my personal experience and on-line research, the Functional Global pattern is an effective and convenient way to manage and process data in a LabVIEW application. I'm wondering though if the FG pattern is indeed as robust as it appears, especially for large-scale applications. Are there any known issues with the FG pattern (eg. memory leaks, lost data, crashes, etc) when used with large amounts of data stored in the USRs or operated for long periods of time? My concern about the robustness of FGs is based on my impression that, although it works well, the pattern seems like an unintended use for a while or for loop (ie running the loop once just to read the current value of previously set USRs). Thanks in advance for your thoughts and comments. John Bergmans
-
Link should be http://labsocket.com/demo/gui_demo.php