

dblk22vball
-
Posts
120 -
Joined
-
Last visited
-
Days Won
1
Content Type
Profiles
Forums
Downloads
Gallery
Posts posted by dblk22vball
-
-
Thank you all for your replies.
As far as my datastructure, here is a sample of what I am saving in a text document currently. I am also saving this to a TDMS file as well (So to answer the write twice comment, yes I am and plan too).
This is from my text doc, tab delimited.
Currently it has the following data:
Timestamp Pass/Fail Reason (for failure) Employee #
and then all of the sensor data (I only copied a part of it, otherwise the post would get huge for no reason):
Cold PSI Mixed PSI Hot PSI Flow Rate Cold Temp Mixed Temp Hot Temp
10/8/2009 3:13:16 PM Pass Pass 105
45. 2.6 44. 3.9 52. 104 145
156 155 154 0.1 51. 104 154
44. 2.7 44. 4.0 48. 107 159
44. 2.6 44. 4.1 44. 104 167
49. 0.3 6.0 0.8 42. 96. 161
44. 2.7 44. 3.9 41. 107 161
5.3 0.6 49. 0.4 40. 110 167
45. 2.8 45. 3.6 40. 103 161
10/9/2009 8:12:53 AM Timed Out Failed Cold Seat Return 105
45. 2.8 45. 4.1 64. 106 145
161 159 155 0.1 57. 107 153
45. 2.6 45. 4.1 47. 107 159
45. 2.6 45. 4.1 41. 106 167
47. 0.0 6.9 0.8 39. 76. 155
47. 1.2 25. 3.0 37. 103 152
As you can see, the first UUT passed, whereas the second one did not, so the second test did not have as much data (fixture stops the test if the current test fails).
And I have been doing this in the free express version of SQL
-
nevermind, just use the array to spreadhseet string vi....

-
I am with you so far

For the comma seperated part, everything would be in one giant one line string, correct.
so it would be: 1,2,32,4,5 and then you take another data point and it becomes, 1,2,32,4,5,6,7,8.
so then when I want to display it in a table in labview (or on a graph), I would have to parse the string and every 4 th value is in the same column, ie 1 and 5, 2 and 6.
-
Thank you to both.
My question with SQL, is how did you push all your data to the database, ie in my case 60 data points on each test. From my reading, that is not a way to easily send an array of data to the database.
My basic data that I am putting in the database for each UUT is: Fixture #, Employee #, Result, Serial # (future addon, but planning for it), and the data (min of 56 points).
I do like the webpage idea, but I would have to get IT involved in that, I am a HTML idiot.
Thanks guys.
-
I am working on an application that will run a series of tests on a part (8 tests right now), and manufacturing/quality would (in an ideal world) like all of the data to be searchable with weekly reporting.
In the past, I have just used a text or datalog file to save the results, as I had only 10 values per UUT, but now with this application I will need to save at a minimum 60 results per UUT (if I only save the identification information and the "evaluated" vales (7 sensors, 8 tests)).
We will also be testing thousands per year, with maybe 100 of them being tested per day, so my text/datalog file would get huge very rapidly.
I am currently saving my information to one TDMS file, with the group name being the timestamp of the start of the test to differentiate each UUT (we are working on serial numbers, since there will be multiple fixtures in the future). This works ok, but I am not sure if this is the best solution for a searchable, data mining application WITHOUT USING DIADEM.
I am not opposed to Diadem (I actually think it is great), but since there will be 10+ people who would like to see the data, the company does not want to shell out hundreds of dollars per computer for them to have access to diadem. And I do not feel like being the "search person" who has to get the data for everyone.
I though of going with an SQL database, but this seemed very cumbersome saving large amounts of data, aka streaming a test. I am also a novice at SQL and IT does not use it often, and do not want me to have access to their server, so I would have to maintain and control my own server.
We use the DSC system on another application, so we do have that option, but again, it is another $800 run-time license for each test station we have.
Can I get your 2 cents or dollar on which one you think might be the best overall solution.
-
most digital outputs are 5 V i Believe.
It also depends on how much current you need to supply. A USB-6008 might work for you if you dont need a lot of current.
Otherwise I would go with a USb Compact DAQ chassis (since it is powered), or if you need the 3 V only, you might need to go with a compactdaq relay module and feed 3 V through it.
-
VIPM Says that I am using Version 0.2, Release 9
I will download the new one above and work with that one now.
-
Is there a list of commands somehwere?
I know in the first post it says that there is a picture of the list of commands, but I am not able to see a picture in the first post.
** EDIT *** nevermind, I looked at the source and found the case that has all of the commands. thanks
-
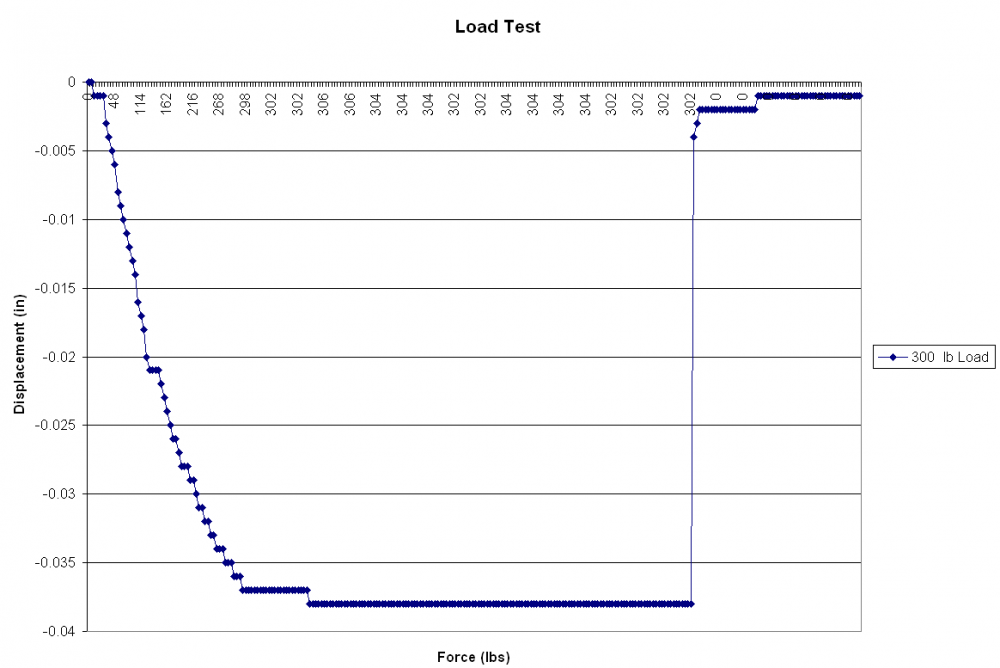
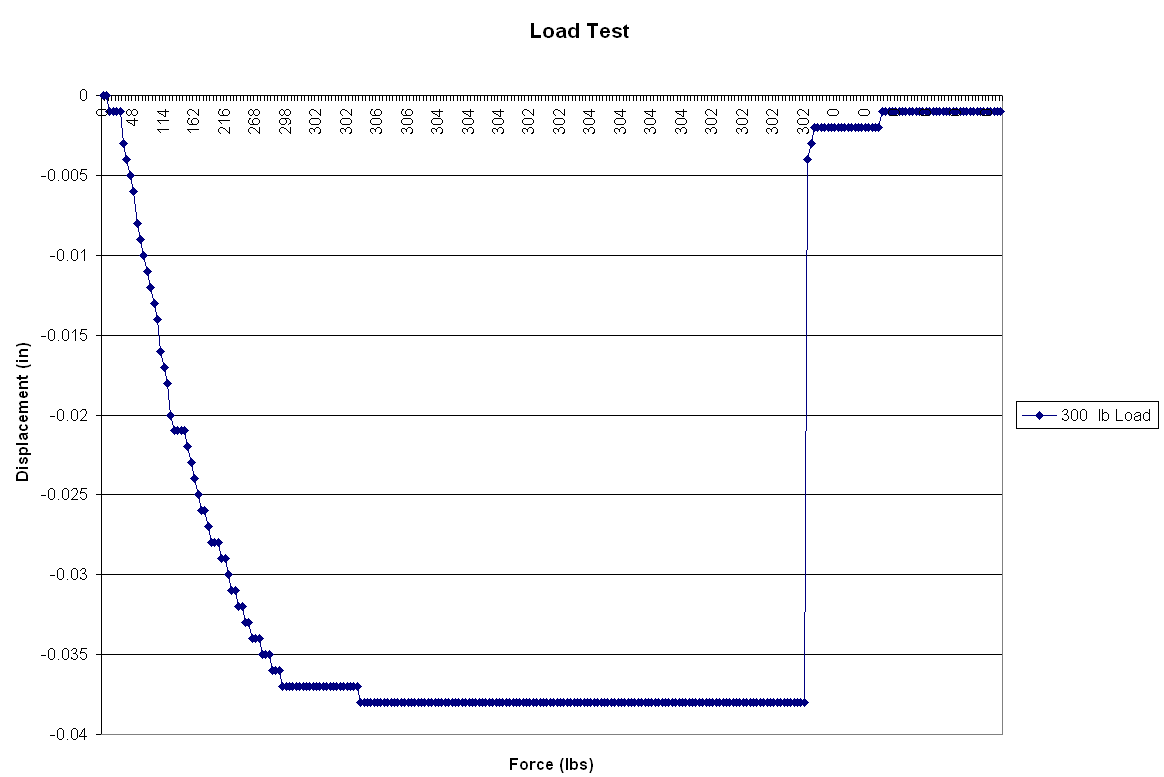
Here is the plot in Excel, as a line graph (what I am trying to do in LabVIEW).
-
Time is not a concern, just the sequence it happened.
Pressure and deflection are all that need to be plotted, just in the sequence in which the data was gathered.
-
I'm not sure what you mean by "duplicate X values", but if you don't want the line to go "back", just sort the data by the X array before putting it into the graph.
I cant sort it, as it would not make sense in the context of the test.
Basically it is a load test, with the X axis being the pressure and the Y axis being the deflection. So you want to see how it defelcted as the load increased, and then when it decresed, as it happened. If you sort it, you cannot tell what happened.

-
I am trying to create a Line Graph in labview that will plot with duplicate X values.
Basically, my data looks like
X Y
0 1
1 2
2 3
2 3
1 1
0 0
The Waveform Graph will display the Y axis correctly, so the user gets the shape, but the X axis is just in numerical order, so it is meaningless (in this case). If you use the XY graph, the line turns back on itself.
I have tried the Xscale marker values property node, but it did not display correctly.
-
I'll also chime in and say Nancy's classes rock! Matter of fact the Advanced class she taught is how I found LAVA and much other LabVIEW goodness on the internet.
I am a third for Nancy, haha. I have taken the Advanced Architectures and OOP Class from her, very easy to understand and knows her stuff.
-
ok, I had the scales set up and added to each channel (as you illustrated), but I was not sure if there was a way to do it in real time.
I will just then start and stop the channels to change it, or maybe I will go back to just reading the voltage and then scaling it afterwards myself so it can be updated real time (the program is not for me, but the foreman on the floor, so the less steps the better)
-
I am looking to be able to use a custom scale (converting voltage to a pressure) and would like to be able to change (calibrate) the scale during run-time in my built application.
I am stuck using a USB-6008 to read the pressure. The pressure sensor is a 4-20 mA device, so I run the device across a resistor to get a voltage and then convert that to a pressure. Obviously, the resistor is not the nominal value, so my conversion will be slightly off, so I want to be able to adjust my scaling factor and be able to see the pressure change.
I know that there is a the custom scaling node, but all that seems to do is change which scale is active.
I did not see a place in MAX to do a "live" update to the scaling.
Can you point me in the right direction?
-
Hi,
I was trying to create a custom drop down menu control as in LabVIEW tool bar using Ring Control and Menu Ring Control. I'm not able to fix either the 'text over the control' or 'drop down position'.
With custom ring control, the down down position is always over the control and with custom menu control, the selected text is over the control.
Is there any simple way other than using XControl?
Soundar.
I am guessing a Custom boolean control (that looks like a menu ring) and then it pops up a cluster with a bunch of picture rings and a text field, all in an xcontrol.
maybe one of the LV gods has a better idea.
-
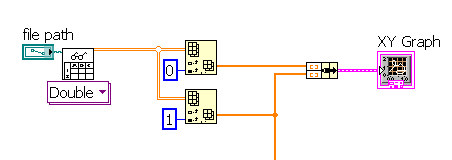
I found your error, it is with inputting a 1D array.
When you input the 1D array, there is no series 2 to delete (ie a second column), so it throws an error. If you input a 2D array (with data in both columns), it works fine.
So you might be able to add a second column of dummy data to the 1D array and then it will be deleted or you could do some more coding to determine the range to graph (if it is a 1D, then only graph column 1)
-
I got the main VI, but none of the sub-vis, aka all of your excel vi's
Macro- It runs fine for me, with no errors, so it is probably something that is being called out of order or a wrong pointer in your excel vi's
-
Can you post your code?? It is hard to determine what the problem is without seeing the code, specially with activeX and excel.
-
I think that your issue is your Convert Dynamic Data to Waveform data. On the Top of that conversion, there is an input that is labeled Channel. By default, it is set to channel 0, which in your case is the relay signal, which is 0 or null most of the time (unless you set the switch to True). If you change that input to 1, it will then integrate your simulated sine signal.
I think that that is the signal you were trying to integrate, but let me know if I am wrong.
And as Paul noted, make sure to initialize your shift register if you want each run to have its "own" data and not include past runs.
-
have you tried calling your local NI rep?? They have always been very helpful for me.
-
With your while loop, add a shift register, and then use the Build array function to create an array of each integration result.
-
I am working on a program that will be conducting a manufactoring test on some of our products. It involves monitoring pressure, temperature and flow rate, and specific ranges during each test (each part has to pass 4-5 different tests).
I was thinking of using the QMH architecture for this, with 3 consumer loops, hardware control, a test control, and data logging/ui update loop.
The test control loop will be the state machine that handles what test needs to be run next, and tell hardware loop if it needs to change an output.
The hardware control will obviously control which digital output is activated, and getting the data from the instruments. It will continually acquire data (when a test is started), and if it needs to change an output, it will be told so by the test control loop.
The data logging loop will log the data and update the controls on the FP (at least this is my thought now). I was hoping to log to a TDMS file (which I can do), which is a waveform, but all of my "data checks" will need to just be the raw data (no timestamp, etc). I am using gauges with 3 needles, so it is a cluster of (3) doubles.
So I was looking to create some sort of central repository that I could put the raw data and then update the front panel, and do the analysis for whether or not to pass the tests.
Do I create a shared varible, or a local varible, and try to control access with semaphors or some other method? Or do I write a temporary file and then everything reads/writes (this seems inefficent).
Or is there a better way to go about this (architecture or central repository)?
Thanks.
-
thank you both for the help, I will definitely look at the MGI tools.
Extending a DAQ USB cable 100ft
in Hardware
Posted
No that it will be much help directly, but here is a post from the other forum.
From NI poster:
We've continued testing on hubs and extenders, but have yet to find any that work to our satisfaction (%100 of the time for every chipset). We have found that name brand powered USB hubs usually work and that active extension cables usually work. We've also found that most USB to ethernet and "wireless" USB extenders either don't work at all with our products, or have unacceptable throughput and reliability issues.