

smenjoulet
-
Posts
126 -
Joined
-
Last visited
-
Days Won
4
Content Type
Profiles
Forums
Downloads
Gallery
Posts posted by smenjoulet
-
-
How do you "stick" an item in position?
Ton is talking about positioning some controls outside the gray resize lines that appear on your FP when you choose Scale Object with Pane. In his picture, he's extended them across the tab using dotted lines. There is a better picture in the LabVIEW help if you search "Scaling Front Panel Objects". You can group controls inside the lines with those outside the lines, and if you get them positioned right, they won't move or will move together the way you want them to.
This is the first alternative option I mentioned to you. I don't really like it except for simple setups. In my experience it can be tricky to get it working the way you want and I'm not convinced it work right across tabs. I'm sure there are rules behind it, but it just doesn't seem to operate consitently for me. YMMV...
That said, why don't you try subpanels if you're comfortable with them. They have there own idosyncrasies, but I believe you'll end up with more control over your UI in the end.
-Scott
-
Is anyone able to save this to a previous version other than 8.6 for the OP?
Both LV x32 and x64 crash if I try to save below 8.6.
Nope. No luck. I even tried rewriting portions of it to see if could get it to save. Crashes every time.
Sorry...
-
As far as I can see, I can either choose one item to scale with the pane, no items to scale with the pane or all items to scale with the pane.
Anyone know different? I really want to control which items on the pane rescale and which simply move with the rescaled objects.
Those are your options. There are no other automatic options that I know of to do what you want.
But you do have a few options:
- Try and use a combination of grouping/locking/positioning of controls on the other tabs like you have done for the four buttons on the first tab. If you have more than 1 control you want to resize on the same pane (i.e. another graph on a different tab page), then this won't work.
- Manage it all programmatically yourself with property/method nodes.
- Look into using a subpanel and different VIs instead of a tab control with different pages.
Good luck! Let us know how it turns out.
-
Re: Groups name...
I don't think even my wife would have figured that one out with have been spoon fed the "pealing" part.
Ben
Are you saying I couldn't make a common, ordinary, everyday connection between "ringing" and "pealing"?

-
1) The 1st picture is from your VI ,"JH_waveform_graph_markers[1].vi
I have circled the divisor, "60" in the picture.
Should this number, 60, be changed based on whether Im using markers for minutes, hours, or days?
I have the divisor set at "60" for my minute chart, "3600" for my hour interval chart and "86400" for my day interval chart
Would these numbers be correct? (see "Waveform Chart Grid Markers.JPG")
2) Using "3600" for hour interval and "86400" for the week chart, Im getting "some extra grid markers" on these charts... (see "waveform chart_extra grid lines.JPG")
Can you tell me why?
J,
1) Yes, those numbers are correct.
2) No, I really don't know why. I see it on the wavefrom graph as well. It is probably some minor bug or anomaly in the graph/chart drawing code. If it bothers you enough, turn off the minor grid for the x scale.
The code looks correct. Remember, to keep gettting new markers you need to add to the list and take off the older markers. I can't really tell if that's what you're doing off to the right.
-Scott
-
Poor OP.
He posts an innocent question and all he really gets is a load of old women arguing about thier crochet patterns

hey Hey HEY! I said drop 2 curl 3, not drop 3 curl 2!

HEY! I resemble that! I'll argue most anything for fun. But I'm glad you said it and not me.
I wonder... Did he ever get his program working the way he wants or did we just send him into an infinit loop?

-
I used to be a stand-in member of a pealing group in my hometown of Orange, NSW. Guess what the group's name was...
Hmmmmm..... The Orange Peals? or Orange Pealers?
-
Charts have a limited history buffer in terms of points. Right click the chart and choose Chart History Length... to change it.
This allows you to set the max points the chart will hold before throwing away old data. It also enforces a relationship between scale min and max. The default is 1024 points. When using time as a scale, a second equates to 1 point (unless you change the Scale setting, similar to offest). 1024/60 = ~17 minutes.
Try setting it to 11000 and you should get better results.
-
I couldnt open that last example, Im using 8.5.1
Sorry, here it is in 8.5
Also this new code I wrote doesnt work with a Waveform Chart, but it works with your Waveform Graph.
I tried to modify your code to give me a 3 hour time span on the X-axis with 1 hr markers.
Do you know why it works correctly in the Graph but not the Chart?
Did you intend to post an attached VI? If so, it's missing.
-
Do you really need a Consumer-Producer design pattern with state machines to see if a value is higher or lower than zero for example?
No, probably not, in which case yours is the simpler solution. I would agree based on the question that is the more likely scenario. But it could also possibly be that he is monitoring multiple controls for value change in the same event case, which starts to favor a producer-consumer or some similar design.
And it's a personal preference of mine that I try to avoid using timeouts in the event structure unless really necessary. There are times when it makes sense, and it's still superior to polling. But it still *feels* like I'm resorting to polling before we got the event structure. Man, doesn't that seem like ages ago.
-
A bit excessive dont ya think?
Why would you say that? I think Mark's proposal is valid, as is yours. When I first read the question, the first thoughts that came to my mind were both of your solutions. Ultimately, it is a design decision for the developer to make and he doesn't offer up enough additional information to make a choice.
-Scott
-
This really seems strange to me. I can't imagine why it would take over 200ms to set something simple like a color property.

It gets even stranger than that, at least for me. I downloaded your example just to see if I could figure out anything. This is what I saw:
If you're near the top of the Tree (first 1000 rows or so) all operations seem to go normal speed. Scrolling (either with scroll bar or clicking the scroll arrows), selecting different rows, and changing tools happen quickly.
But scroll to the last row and everything slows:
1) Scrolling slows to a crawl
2) Selecting rows is abysmally slow
3) Changing the tool is slow. Try hittting <TAB> 4 times quickly to move through the tool selection and watch the lag.
4) Even changing front panels is slowed. Switch from an empty VI to the example and back a few times. Scroll up to the top of the tree and repeat.
I've seen it on two PC's, both in 8.6 and 2009.
It's probably all related so hopefully it can be addressed by the same CAR.
-Scott
-
J,
There are two problems with the example code:
1) The major problem is you were running at a faster loop rate (generating simulated data) than the actual time was changing, Therefore the chart was scrolling faster than new marker lines were being added. The modified VI below adds some "simulated time" to account for this. If you ran your original at a normal rate, it would look to work ok.
2) You keep adding data to the markers array, but it is mostlyd uplicate data. You are growing a larger and larger array. Eventually, all this array data and large marker list will at some point start to hurt the performance of your app. I have modified it to only add a new marker when it doesn't already exist in the list. This marker array will still grow unlimited, but at least it won't have duplicate data. You could further modify it it to have a limited number of markers in the array, say 60, by removing old markers when adding new markers.
-Scott
-
I can understand if found a point that was actually within the data set, but the peaks it found are all greater than actual points in the data set. The max value in the data is 1.3, but it returned 1.43 as the max. How could an interpolation come up with that value?
It's doing a quadratic fit on the data first and then doing the interpolation on the fit. With your sawtooth, I guess the fit isn't very good, so you get values way beyond your peaks. It's probably better used for continuos data, than discontinous data like a sawtooth. Still the locations are pretty close, so I think you can use those in some fashion to get your actual peaks. Take a look at my modification.
I haven't used the Threshold Peak detector in awhile, so my memory of it was incorrect.
-Scott
-
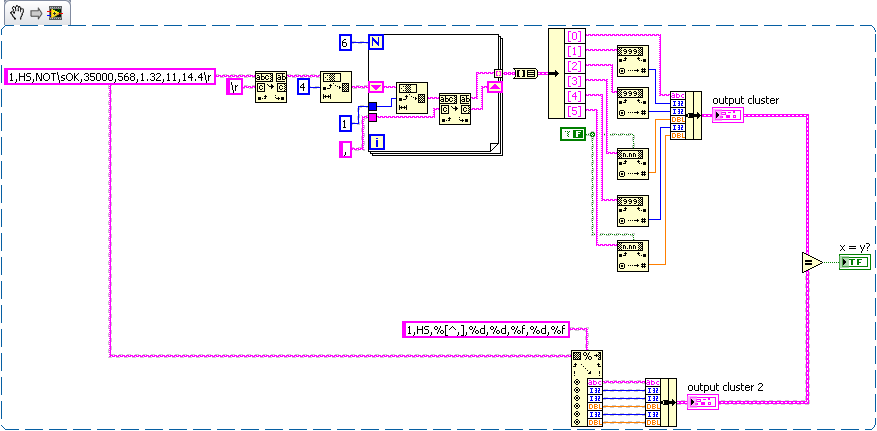
I'm not trying to get anyone to change their implementation once they have it working, but I fail to see how the "top" is clearer and more efficient than the "bottom". Both give the same result. If this is always the format of your data (header, string, int, int, float, int, float) then the bottom "scan" should work fine.
I do agree that you certainly get to know the string palette well.
-Scott

-
 1
1
-
-
Windows XP Pro users can tell Windows never to restart the computer automatically. In order to do that follow these steps.
-
In theStart Menugo toRuntype “gpedit.msc” and pressEnter
-
Now a Group Policy editor will open. In this window navigate to:Computer Configuration -> Administrative Template -> Windows Components -> Windows Update
-
Double click onNo auto-restart for scheduled Automatic Updates installations
-
In the settings window ChooseEnabledand clickOK
- Close Group Policy Editor
Good Advice! However, if you work in a large organization with a separate IT department, they will probably govern when updates happen through other means (Microsoft SMS or internal mechanisms), and not Windows Update. In fact, they probably disable Windows Update.
You'll need to work with IT to find out what mechanisms they use and to get your Lab systems exempted from automatic updates and get them done manually. Or if they still push they updates, at least find out how to delay or disable the automatic restart.
-Scott
-
-
What the heck's going on?
George,
It is interpolating the data. From the detailed help for the Waveform Peak Detection.vi:
Locations contains the index locations of all peaks or valleys detected in the current block of data. Because the peak detection algorithm uses a quadratic fit to find the peaks, it actually interpolates between the data points. Therefore, the indexes are not integers. In other words, the peaks found are not necessarily actual points in the input data but may be at fractions of an index and at amplitudes not found in the input array.
To view the locations in terms of time, use the following equation. Time Locations = t0 + dt*Locations
Amplitudes contains the amplitudes of peaks/valleys found in the current block of data.
What's wrong with the Threshold Peak Detector that you also have dropped on your diagram? That should give you the correct results.
-Scott
-
Can the same concept be used for a Waveform Chart?
I tried to get it to work with a Chart, but it not going well ...
Can you tell me what Im doing wrong?
You can try it with a chart, but you need to link the property node to the chart and not the graph. You also can't bundle the two values (timestamp and random data) like you are doing for the chart. That will give you two plots, not one plot with timing info. If you want the timing info for your data, you need to use a waveform.
Will your graph continue to scroll to the right as the data & time fill the first page?
I will need the X scale markers to continue indefinitely until the test is manually stopped.
No, the data won't continue to scroll after you reach the end of the graph. We've set up a fixed time axis, so when the # of points passes that fixed scale, the new data will no longer appear. The data is still there, of course; you just can't see it. If you change the end time on the scale or turn on autoscaling, you'll be able to see the data.
To get a fixed time window to scroll, you'll need to manage that programmatically. I can work up an example for you, but I encourage you to continune to play around with it and see if you can get it to work. If you can figure out the how and why it all works on your own, you'll be in a much better position to adapt it in the future.
If you can't get what you want by the end of the day, post back with what you have and we'll work up some more solutions.
-Scott
-
For some reason, I'm picturing Ben Stein in front of room full of anxious LAVA'ers and monotoning "Aivaliotis? Aivaliotis?"

-
I would like to be able to have a variable which the user can set according to which brand of videoserver/IP camera he wants to acsess. This variable will then be use to determine which ActiveX control that should be placed inside the ActiveX window.
Is this possible or will it be easier to have many ActiveX windows behind eachother in the frontpanel and then use show and hide to display the correct window/activeX control?
Whaler,
No, you can't change the ActiveX control in an ActiveX container programmatically at run time. However, there are a few options open to you.
1) You can do as you suggested and show/hide the correct controls at runtime based on user input. That would be the easiest.
2) You can put your ActiveX controls on different VI's and show those VI's in a subpanel, again based on user input.
3) Same as #2, but instead of using a Subpanel, just open the Front panel of the correct VI and float it.
There are other options, but one of those should work for you.
-Scott
-
Pop quiz: what does the "V" and "I" stand for in "V I Engineering"? (VIE employees are exempt from participating in this quiz).
Value & Integrity.
Yee haw! What do I win?
-
So the X-axis may be like this 2:00pm 2:01pm, 2:02pm 2:03pm, etc and the 15 th data point should always match up with a 1min marker
Here is a picture of my Waveform Chart Im currently using...all I need is 1min intervals on the X axis.
And the 1min intervals should be crossed in real time about every 15th data point
(since my scan rate is 1 sample/ 4sec)
I don't agree with your statements or I'm reading too much into them. I think we need to establish whether you are wanting to use relative time or absolute time on your x-axis. Using "2:00pm, 2:01pm, etc." in your first post makes me think you want absolute time. But the general statements that every 15th point should match up with a 1 minute marker make me think relative time.
1) If you use absolute time, every 15th point (starting from 0) will not necessarily cross a 1 min mark. It all depends on when you get your first point. If your first point is at 2:00:16pm then the 15th point will be at 2:01:16pm. The 11th, 26th, 41st, and every subsequent 15 points will cross at 1 min marks.
2) If you use relative time, then every 15th point (0th, 15th, 30th, etc.) will fall on a minute marker, but you won't have the actual time of day on the axis. It will just be elapsed time from the start of your app.
I'm going to assume you want #1 and that I'm just being obtuse and reading too much into your description. I've attached an example that will show this with a waveform graph. Again, for me, charts are too finnicky and limiting to deal with, at least in this instance.
Let me know if this gets you closer still...
-Scott
-
Here is my attempt at the Waveform Graph
Im trying to set 1 min intervals on the X-axis
I will have 3 pieces of data average, std deviation, and Time
My 1min intervals are not being set by the graph properly
Any reason why?
J,
They're not being set properly because you are stripping the time info by combining the waveform into the array of random numbers. The waveform is being cast to just data without any timing info. Your net result is you have a 3 element array with no timing info, so on the graph it just shows 12/31/1903 (default "0" time for LabVIEW) and never increases.
I'm attaching a reworked VI that shows the progression of going from A) where your're trying to start from to B) where I think you're wanting to go.
It has 2 loops in it. Loop 1 is where you were trying to start but getting confused. Loop 2 is a rudimentary implementation of what I believe you want. I have included comments in the VI to help you out a little.
Digest that for a bit and see if that helps and what additional questions it prompts.
-Scott
As an aside defualt "0" time in LabVIEW is actually 12:00:00 AM 1/1/1904 UTC, but your time may be a little different based on your time zone.
-
LabVIEW doesn't have the erf function natively, but the MathScript node seems to. You could implement your function as a whole using that.
Actually they do, under the Mathematics >> Elementary & Special Functions >> Error Functions palette.
You need Full or Pro versions. The LabVIEW Base package does not include the additional mathematics functions.
-Scott
How do I create fixed X-Axis intervals using Chart Properties?
in LabVIEW General
Posted
What was the time range of the chart? What were the other markers?
A couple problems:
1) You're creating a runaway list of markers. You're adding 3 markers every minute, so that's 180 markers every hour, and so on. It is unnecessary, so you should either a) delete older ones from the list when you add a new marker or b) recreate the marker set when you need a new one and just write that to the property node.
2) If you're not using an absolute time for calculation of markers and plotting data, but assuming the data is coming in at a constant rate, then it's very possible your chart could be off from the PC time. Using your previous statement that the data comes every 4 seconds, if it actually comes in at 3 seconds, your chart will run fast. If it comes in every 5 seconds, your chart will run slow.
Your markers are calculated off an absolute time, so other than issue #1 with growing the marker list unbounded, that shouldn't be a problem. My guess then is that you have an issue with the timing of your data. Without seeing more of you app, it's hard to tell.
-Scott