

lvb
-
Posts
209 -
Joined
-
Days Won
7
Content Type
Profiles
Forums
Downloads
Gallery
Posts posted by lvb
-
-
QUOTE(crelf @ Feb 16 2008, 06:16 PM)
I was attempting to use the XML file as a last resort. Has anyone made any discoveries if using DAQmx property nodes?
-
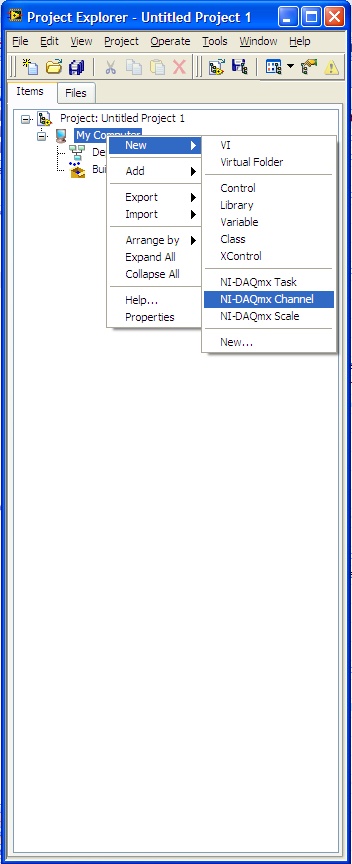
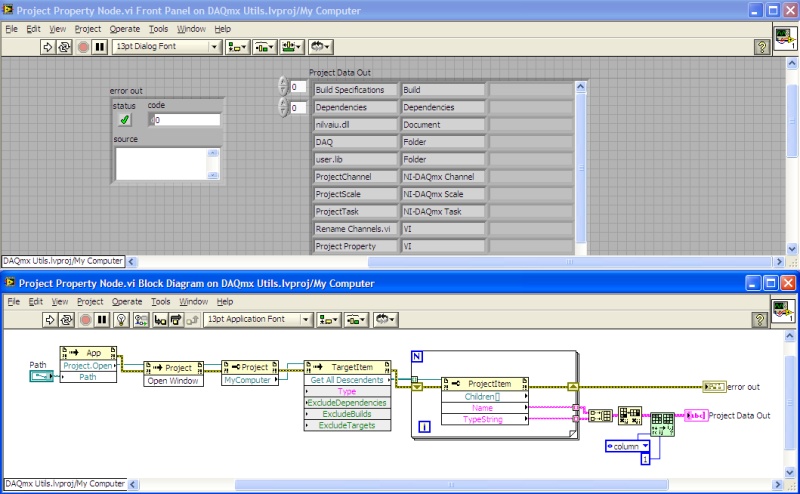
In the "Project Explorer" for a .lvproj file, you can create NI-DAQmx tasks/scales/channels. I am looking to modify these dynamically and achieve the following goals:
How to read all channels/tasks/scales in a project?
How to write a channel/task/scale in a project?
How to delete a channel/task/scale in a project?
Below is some code I used to detect what DAQmx items exist, but how can I acess them using the DAQmx property nodes dynamically?
Thanks

-
Very nice. Your implementation is very scalable. My 5 minute implementation is below:
-
 1
1
-
-
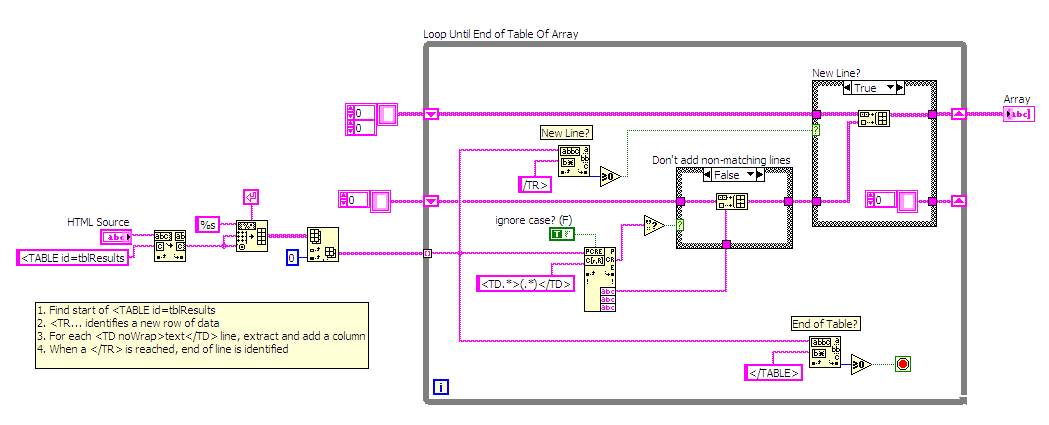
I have an HTML table that I would like to parse, and don't want to re-invent the wheel if possible. The end goal is to extract the latest row of data in the HTML file based upon serial number and save the results to a file appended with some LabVIEW test data (voltage, current).
Are there any existing libraries that can take the table attached (code sample is attached) and parse to a LabVIEW data type (I was thinking a LabVIEW 2D String Array)?
If not, my method would most likely include regex to find the start of a table and parse while iterating through each line...
-
QUOTE(mross @ Oct 22 2007, 09:04 PM)
I guess I was too cryptic, by "higher level" I meant, What is the top level goal? Removed from any real world context it is like a class assignement or something. What is the point of this? What is the data about? Is the analysis strictly eye to brain (why else smooth the data?)? What decisions will be made from the result?On some level an acquisition tells a story. Mostly the stories mine tell are where and how does this hall effect sensor respond to changing flux. Or when I vary the pulse width of this signal how does this actuator change its angular location, and what are the secondary conditions that may impact this? A favorite I remember on another list was, What is the amount of urine these mice produce, and when? I never did hear how that turned out.
Truth is I still don't get it, so I can't say what you should do. I can't do better than Yen's answer, which is a general recipe that could work.
Do you still have a problem with the idea of a circular buffer and how that fits into the scheme of things with LabVIEW?
Mike
Mike,
The top level goal is to allow for data to be acquired from a mix of pressure, temperature, torque, motor power, motor speed, volume flow and other senors for exciting a component in a circuit simulating an vechicle cooling system. Some performance reports are looking at a step response, which would require a data rate of 20Hz. Other reports are temperature loss over time (0.1 Hz for 1 hour straight). Hence the need for multiple sample rates.
I am currently using a circular buffer for the analog data. I was trying to avoid creating another while loop, and had the idea of a "save data" case in my state machine that gets called roughly 20 times a second. The purpose of the post was to inquire on techniques to achieve accurate extraction from the analog signal and it sounds like Yens approach is the best suggestion so far.
Thanks for the responses
-
QUOTE
Your description is kind of hard to follow and seems to be making a simple problem hard. Could you describe at a higher level what you are needing to do without assuming what the best way to do it may be? The lack of replies probably reflects the complicated presentation of your questionsI apologize for the confusion, let me try to clear this task up.
The user wishes to select a data save rate in msec (see the attached image).
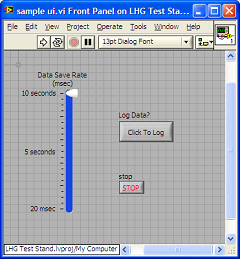
A data row should be written at each time interval with averaging or "smoothing". For slower data save rates, the largest number of samples to average is 0.1 seconds (or 100 samples).
I was planning on using the same averaging technique in the Decimate Single-Shot.vi (If averaging is TRUE, each output point in decimated arrayis the mean of the decimating factor input points.).
When the user stops logging, the correct number of rows should be written to file. (duration in seconds x data save rate)
QUOTE
A.data logging at a rate of 50 Hz to 0.1 HzIs this a requirement for the rate at which file writes actually happen? Why such a large allowable range? It seems strange for a spec to suggest a rate as high as 50 Hz if it also allows a rate as low as 0.1 Hz.Once logged, must the stored data represent samples that are equally spaced in time?The file writes do not have to occur at the data logging rate, but the samples must be spaced at the data save rate (i.e. for 10 Hz 0.1, 0.2, 0.3, ...). If the user turns on and off logging quickly, the correct number of rows should exist in the file (duration in seconds x data save rate).
QUOTE
B.data written should be decimated and averaged over the last 100 samples read from the DAQSo, each data point that is logged represents an average of the most recent 100 samples? Is overlap allowed between those sets of 100 samples? Are you allowed to miss any of the DAQ data? Or must you produce exactly 1 logged data point for every distinct set of 100 DAQ samples?Let me clear this up with an example. If the data rate is 0.1 Hz, the 100 samples read from 0.0 - 0.1 should be averaged into a single number. If the data rate is 20Hz, the 100 samples just read should be decimated (with averaging) to produce 20 rows of data/second with a timestamp column incrementing according to the data rate (0.00, 0.05, 0.10, 0.15, ...)
-
QUOTE(Yen @ Oct 21 2007, 05:14 PM)
I'm not entirely sure I understand your requirements, but here's what I would suggest --
Read the DAQ as fast as you can into a circular buffer LV2 global (you can see a quick example http://forums.ni.com/ni/board/message?board.id=170&message.id=129454#M129454' target="_blank">here, but be sure to use Replace Array Subset and Rotate Array instead of building and deleting. You will also need to replace more than a single element). Make this buffer large (e.g. 1K or 2K samples).
- In another loop, read this global at your logging rate, take the last 100 samples from it, average them and throw them into a queue.
- You can now dequeue the same queue in a third, lower priority VI, or wait until the measurement is over and then save everything at once.
Couldn't it be possible to skip the circular buffer and use a VIG w/some sort of algorithm to determine how much data to write every time it is called? This is along the lines of what I was thinking, but am having some issues with implementing.
-
Read the DAQ as fast as you can into a circular buffer LV2 global (you can see a quick example http://forums.ni.com/ni/board/message?board.id=170&message.id=129454#M129454' target="_blank">here, but be sure to use Replace Array Subset and Rotate Array instead of building and deleting. You will also need to replace more than a single element). Make this buffer large (e.g. 1K or 2K samples).
-
I have an application that reads 100 samples of analog data from a task running at a hardware rate of 1kHz into a 1D array of waveform.
The specification requires data logging at a rate of 50 Hz to 0.1 Hz. The while loop that contains the file save VI runs at a rate of approximately 20Hz (but can change due to software timing).
Regarding program architecture, the program should write to file at the data logging rate (i.e. 50 writes/second for 20 Hz and 1 write per ten seconds for 0.1Hz)
Requirements:
The number of samples read has to be greater than the logging rate
The data written should be decimated and averaged over the last 100 samples read from the DAQ
My initial thought was to create a VI that does the following:
Create a while loop that checks the time from last save.
If time > logging rate time, then write to file
Number of rows to write = # of logging rate iterations since last saved. (i.e. if 50Hz logging rate, and time since last save = 1 sec, then write 50 rows of data)
The problem is the decimate function only accepts integer data which could result in roundoff error over time. So my question is, what kind of techniques can be utilized to make this VI operate properly?
Thanks!
-
My solution was to use a functional global that stored the values written to outputs channels in a shift register. There is a "read" command that allows to recover this data. The only limitation to this is that one cannot read values written by other applications.
-
Is it possible to read the value of a static output card in LabVIEW or for that matter, any output card?
I am using a NI PCI-6704 voltage/current output card. I would like to read/monitor the voltage/current that a few channels are set at.
I attempted to do this with a DAQmx Read VI, but it returned an error. (I am not on the DAQ pc at the moment, so I don't have the error code)
Thanks...
-
QUOTE(Justin Goeres @ Sep 10 2007, 01:25 PM)
This doesn't go to your immediate problem, but in general you might want to check out UltraMon if you work with multiple monitors regularly. It lets you set up different multi-monitor profiles, manages icon positions, puts a taskbar on the second monitor, etc. (I don't know how much of that might also be available in normal Windows now -- it's been so long since I lived with UltraMon ).
).
QUOTE(Bab @ Sep 10 2007, 06:00 PM)
give it a try...BaBI just downloaded UltraMon and it looks like UltraMon will do the job for me with the Move and Stretch commands. Another neat feature is that I have the monitor profiles load upon login (different user for home/work)!
-
Using the new CompactDAQ series, I have found a significant lack of information:
I am using a CompactDAQ unit with a NI-9233 IEPE module for dynamic pressure monitoring. The 9233 has a discrete amount of sampling rates available, defined by Fs = 50kHz / N, where N is an integer 2 . . . 25. This thread covers the fact that this is NOT documented anywhere in the manuals!
Hope this example helps...
-
For some reason, the LabVIEW development does not like to use multiple monitors. I use multiple monitors at work and home, but the VIs always open in the last location in which they were saved.
If the VI is saved on the secondary monitor, and then opened on a PC with a single monitor the VI opens "off in space" on the non-existent monitor. My work PC has the secondary monitor on the "right" and my home PC has the secondary monitor on the "left. I always work on the secondary monitor since both of them are nice large widescreens.
What would be "nice" is if there was a way to force VIs to open to a "default" monitor, always the secondary in my case!
Does anyone have advice on how to improve this situation?
Thanks!
-
QUOTE(tcplomp @ Jul 3 2007, 02:06 AM)
Unfortunately, this is an application that will be run on LabVIEW FDS.
QUOTE(Eugen Graf @ Jul 3 2007, 04:39 AM)
As a feature of the application, I want the operator to view only a single screen at a time, but I appreciate your approach in other instances.
Thus, I am leaning towards using sub-panels which would create a scalable approach...
There are a few "gotchas" to the sub-panel approach that I see:
1. I need to constanly run data acqusition and control (PID loops) in some "main" vi. I could do this in a few ways:
a. Run a "hidden VI" continuously in the background
b. Run a parallel while loop in the "main screen"
2. I have some charts on a screen in which I want to maintain a "history" of the last 5-10 minutes of data. I see two options here:
a. Maintain a circular buffer of data for each chart
b. Load the chart VIs with the main VI, but show/hide them and continuosly populate them with data
Please give me any advice you can think of, I appreciate all of the knowledge!
Thanks
-
I am seeking some advice in application architecture in a multiple screen user interface with simultaneous acquisition and control.
My goal is to create an application framework that:
1. Is always running data acquisition and control in the background
2. Can display multiple screens that sometimes duplicate indicators and controls (Please see the attached files for an example of what I mean by duplicate controls. Basically, I have a type def of controls or indicators on multiple screens.)
Features:
Each screen shares a common title bar that contains screen navigation and DAQ file save buttons.
Multiple detail screens display indicators and contain controls relative to device control. Some of these are duplicated.
The application must be capable of controlling multiple control loops while displaying various GUI screens for detailed display of parameters.
I am surveying the Lava groups for advice from some more experienced members in how I should create the framework for this application. Maybe a discussion of the pros/cons?
Mainly the feature of a "common title bar" has lead me to the use of a sub-panel or tab control where the VI that contains the title bar has all DAQ and control...
Here are my current ideas:
1. Tab Control (like the attached example)
Good: No need for
Bad: Not scalable, too many "duplicate" controls within the same VI get confusing
2. Sub-Panels
Good: No duplicate controls within a VI, scalable. ?
Bad: Not sure how to avoid over-use of global variables between sub-panel and main controller window (Please advise...). Need to manage launching with VI server property nodes. ?
3. Your ideas here!!!
TIA!
Here is a screenshot for < 8.0
http://forums.lavag.org/index.php?act=attach&type=post&id=6292
-
Just wondering if anyone here has some tricks displaying mathematical equations on a front panel? I usually enter the equation in word and then copy/paste onto the front panel...
-
I have hit a roadblock in GUI design for LabVIEW. I am attempting to create a "boolean button array" that has different text descriptions on each button. This can be easily done on the front panel using the boolean text of a button. However, my application requires the creation of dynamic button arrays. I will have a setup screen where the user can add and remove buttons (note the purpose of these buttons is to toggle a "DAQ" profile that displays different channels and scaling). I have attached a sample screenshot of the layout.
How can I dynamically add or simulate boolean text on a button?
If I create an array of buttons, the boolean text is the same.
If I create an array of clusters that contains a button and a text string, I cannot obtain events properly.
I have attached my starting VI and a picture of what I wish to add/remove items from during execution (dynamically). I am sure that some of the gurus on here have an elegent solution!
Thanks
-
QUOTE(dthomson @ Jun 12 2007, 05:11 PM)
Brian,Buddy Haun, an Alliance member here in Colorado, and I discussed our similar efforts to solve these types of situations some time ago. He developed some interesting techniques for dealing with this that go beyond what I have done. You should be able to find an e-mail address for him through the Alliance list on ni.com.
The basic idea is to use a hierarchy of type-defs. Use one non-strict type-def to define the type of your data. Then make several strict type-defs that each use the non-strict type-def within them. Each of these strict type defs can have a different appearance. When you alter the root type-def, you'll need to update all your strict type-defs, but those will be the only edits. All the instances in all your VI's will then be updated as you desire. Using this technique, you can display the same data cluster in multiple places, but hide certain elements from the user depending on the context.
Cheers,
Dave T.
Interesting! This sounds like a great idea. The main reason I started this thread was to find "solutions/work-arounds" of this manner. Do you have any examples?
-Brian
-
I am looking for some advice in the use of type defs...
Upon selecting the "Update from Type def." option, my screen layout is lost.
1. Is there a way to update the "data" of a type def. and not the screen layout?
I understand that the better solution would be to layout the typedef to match the desired screen layout, but what if I want to use the same typedef in two different layouts on two different front panels?
2. How does everyone deal with updating typedefs if this is the case (lose layout when updating typedef). Is it best practice not to use typdefs for front panel layout? When to use strict
Thanks!
-
I have a situation that requires multiple devices to read from a single DAQ and am in need of some architecture/implementation advice. I am reading 3 analog channels, from which multiple independent VI's must read at various times based upon the integer representation of a digital port.
For example:
VI "A" reads from all analog channels upon user event "view" button
VI "B" reads from all analog channels when the digital port = 2.
VI "C" reads from all analog channels when the digital port = 4
My idea was:
All 3 analog channels are ALWAYS being logged to a buffer of 10 minutes of data (200Hz)
Start/end times are logged to global timestamps upon rising/falling edge of the port value changing
Upon the falling edge, a global boolean turns on that triggers a user event on VI "A" for processing of the data
Example Situation:
1. The digital port changes from 0 to 2 which triggers a write to a global "start" timestamp
2. The digital port changes from 2 to 4 which triggers a write to global "end' timestamp, the global boolen to turn true, and then a global "start" timestamp is written to
3. VI "A" begins processing the data form the waveform between "start" and "end" time
4. During this, the user selects the "view" button in VI "A" which waits "n" seconds and then copies the last "n" seconds of data from the global waveform
I am not sure if my architecture is the best approach, but it is the only I could think of with multiple independent VI's simultaneously reading from the same DAQ.
According to: http://forums.lavag.org/Ideas-for-parallel...data-t5712.html this approach was used, but I am still looking for advice.
Thanks!
-
Thanks for the advice regarding TestStand. However, I am seeking advice in techniques to accomplish the forementioned task in a LabVIEW g-code application. I do have the Professional development system, so X controls are an option and I am using LabVIEW 8.2.
Current applications I deal with (that others designed) utilize multiple for loops which is really bad (i.e. 4 for loops for 4 stations!). I haven't seen any good examples beyond a simple state machine. My thoughts thus far are to utilize GOOP to create a class for each station. However, I could use some advice in how to implement the control logic. I currently use re-entrant VI's, but I could also use some advice on how to debug a re-entrant VI while multiple stations are calling it.
QUOTE
Also, what type of daq hardware are you considering/using for your application?Most applications utilize USB-based DAQ. A few of them would use CompactDAQ..
Thanks again!
-
I am seeking advice on architecture of a multiple Unit Under Test (UUT) controller. To be extremely generic: Most applications require turning on/off a sequence of digital outputs based upon digital inputs, setting analog outputs, and finally capturing the resulting analog data
Most of my designs consist of a single GUI and control loop. However, when creating a multiple-station controller I cannot seem to come up with solution that is elegent and easy to debug.
So... I come to this forum to seek advice. Please let me know if there is any additional info that may help!
Thanks
-
Thanks Mike, advice taken.
-
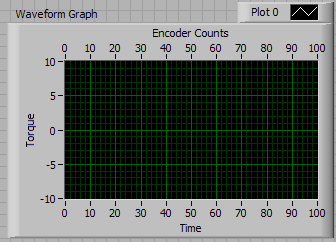
Measuring a window regulator's torque vs time and torque vs encoder ticks (position). Just acquiring data and plotting, no analyzing.I said: What exactly are you measuring and what sort of decision do you need to make based on the data?This is very important to give you a useful answer, and I am not fond of spending time explaining the wrong solution.
You said: This should be answered above
Actually, you never said what decisions you need to make. I chose the wording of the question carefully. But your answer never addressed that, only some specifics about the acquisition. Your task is probably not to acquire data, it is to make some sort of choice after analyzing the data. What its that choice?
You said a few rpm/sec. I assume you don't mean an acceleration and that you do mean it will be turning slowly at a a low speed so that you don't anticipate any problems acquiring the data fast enough?Assuming the second, you might be surprised how much horsepower it takes to digitaze an encoder pulse train. At some point you may want to quantify how accurately you need to measure these things and whether you have the equipment to do it.
I have requested the details, but have not been given them.
I would like to use the cheapest USB DAQ device available. I currently am thinking about the USB-6210. The user wishes to view two types of graphs: 1. torque vs time and 2. torque vs encoder ticks. How can they view torque vs time if an external click is used for data acquisition? Also, I am not looking for velocity.You said:Speed is not calculated, just torque vs ticks displayed.
The user needs to be able to select torque or time from an x-axis listbox. This will update the display of the acquired data plot.
If you do not need to know speed then you do not need to gather your torque data in the time domain. Just use the encoder to clock the acquisition. Then you have torque versus angular position.
If you did want an estimate of speed over a rev you could count pulses from the encoder during some period and return speed from that using counter/ timers on the card (it never hurts to tell us whatdaq card you are using, the version of LV, and so on. You would be surprised what interesting suggestions/warnings you might get from this info.)
For getting data clocked by an encoder I use Acquire N Scans D-Trig Ext Scan Clk.vi as a basis. A digital trigger starts the acquisition (use the Z pulse of the encoder), tell it how many readings to take (maybe the same as you ticks per rev) and you will have what you originally asked for voltage with respect to encoder ticks. I usually calculate average speed before or after the acquisition step to put in the records for the test. That is a straight forward counter timer function with the encoder gating a counter.
Lastly:The user needs to be able to select torque or time from an x-axis listbox. This will update the display of the acquired data plot.
This sounds like the cursor function that is provided with the graph indicators. Did you need something more than that?
But earlier you said torque versus ticks, and now you are talking about time on the x-axis. Can you clarify?
Hmm, I am not on the same page as you here. My initial thought was to somehow display two x-axis scales (one on top and one on bottom), not quite sure how to do that, but anyways... The user needs to be able to view EITHER torque vs ticks or torque vs time.
Thanks for the help!
Here is a sample:


cDAQ - one module chassis?
in Hardware
Posted
Nice to know they are now selling it as an individual module.
Last October, I had a spare IEPE 9233 I wanted to use with the carrier. I had to purchase a USB-9421 just to get the carrier module!