kap519071680
-
Posts
8 -
Joined
-
Last visited
kap519071680's Achievements
")
Newbie (1/14)
0
Reputation
-
Using timestamps to integrate data at specific values
kap519071680 replied to kap519071680's topic in LabVIEW General
Thanks! I will try all of the suggestions and update if it works or not. I really appreciate all of the help! -
Using timestamps to integrate data at specific values
kap519071680 replied to kap519071680's topic in LabVIEW General
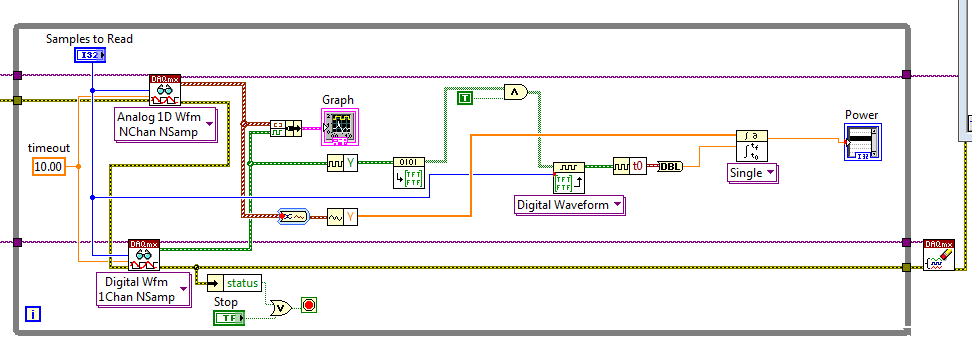
I am looking to perform integration on live data. I've setup an index search to find the index for the transition to high and the transition to low as you were saying (attached image), but can I use the indices as my intervals of integration or do I have to use the time stamps? Or do you suggest something else because I want to do it live?
-
Using timestamps to integrate data at specific values
kap519071680 replied to kap519071680's topic in LabVIEW General
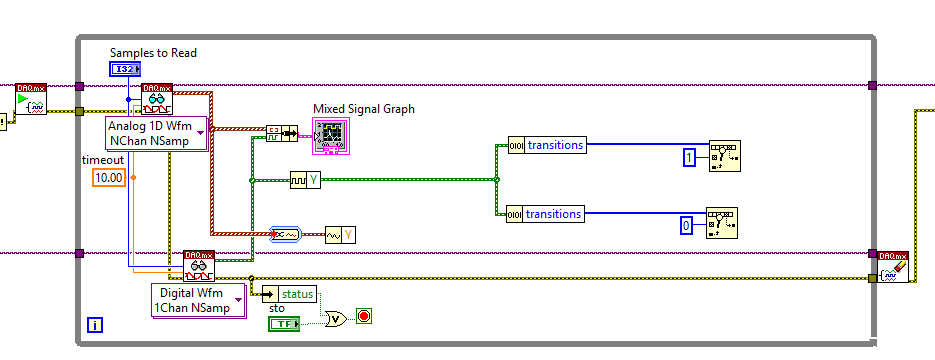
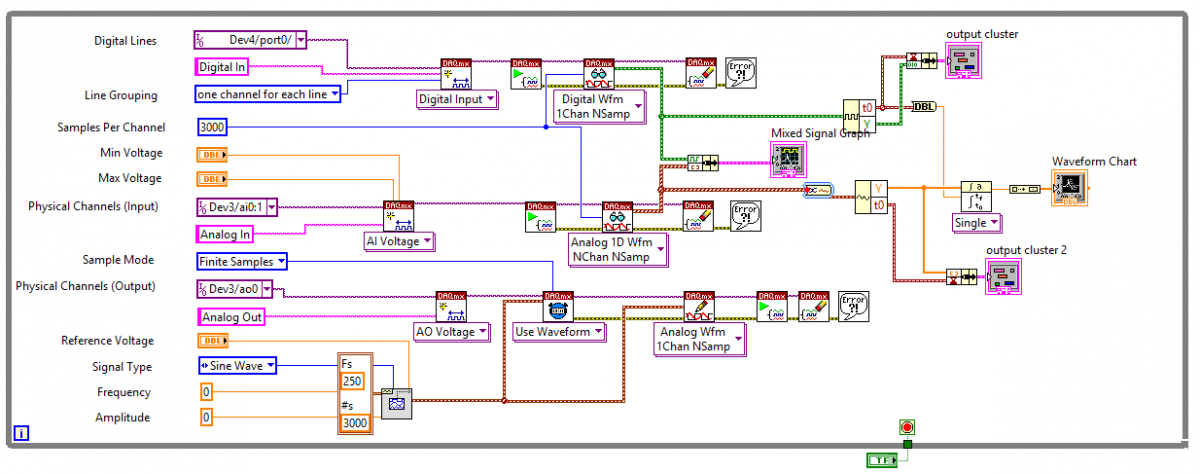
Currently each input has its own sample clock and the waveforms are synchronized. I am confused as to how I would go about extracting the intervals to integrate the analog input data. I thought I would first have to do some sort of check to see if the digital input is high and if it is then continue to get the timestamp, but how would I get the time at which it goes back to low? You are saying I can use an array index to get the right intervals if they are synchronized but I'm not completely understanding. I've attached an image of what I have so far along with another image of what I've tried to do to get the right timestamps..
-
Using timestamps to integrate data at specific values
kap519071680 posted a topic in LabVIEW General
I'm trying to integrate data from one waveform graph that depends on the timestamps of another. What I have setup is digital waveform and an analog waveform and I would like to integrate over data from the analog waveform whenever the digital goes high. My idea on how to approach this was to check when the digital input goes high and then low, and at the those timestamps as my limits of integration, however, I'm not sure how to go about this. What I have tried to do was to take the digital input data and AND it with 1 to see if it is high, and then take that data and store its timestamp in an array and then input those values when integrate, but this is not the correct approach because it will not give me the right intervals for integration. I think what I am having trouble with is getting the timestamps of when the digital input goes high and then back to low. Does anyone have any idea on how to approach this problem? I would appreciate any suggestions. Thank you! -
Synchronizing digital and analog waveforms
kap519071680 replied to kap519071680's topic in LabVIEW General
Thanks for the tip. I tried my VI with a different DAQ and it is working properly. -
Synchronizing digital and analog waveforms
kap519071680 replied to kap519071680's topic in LabVIEW General
Thank you for testing that. It seems that my hardware is the issue and I am planning on using a different DAQ to test my code. Hopefully it will work this time! -
Synchronizing digital and analog waveforms
kap519071680 replied to kap519071680's topic in LabVIEW General
I also came across that example and tried using it will my setup but I continue to get an error when using the sample clock with the digital input. I also just tried setting up a really simply VI with a digital input and sample clock but it never seems to work. I'm not sure if I am making a mistake or if the issue is my hardware. The error that i get is, "Error -200077 occurred at Property Node DAQmx Timing" and the possible reasons was "requested value is not a supported value of this property" -
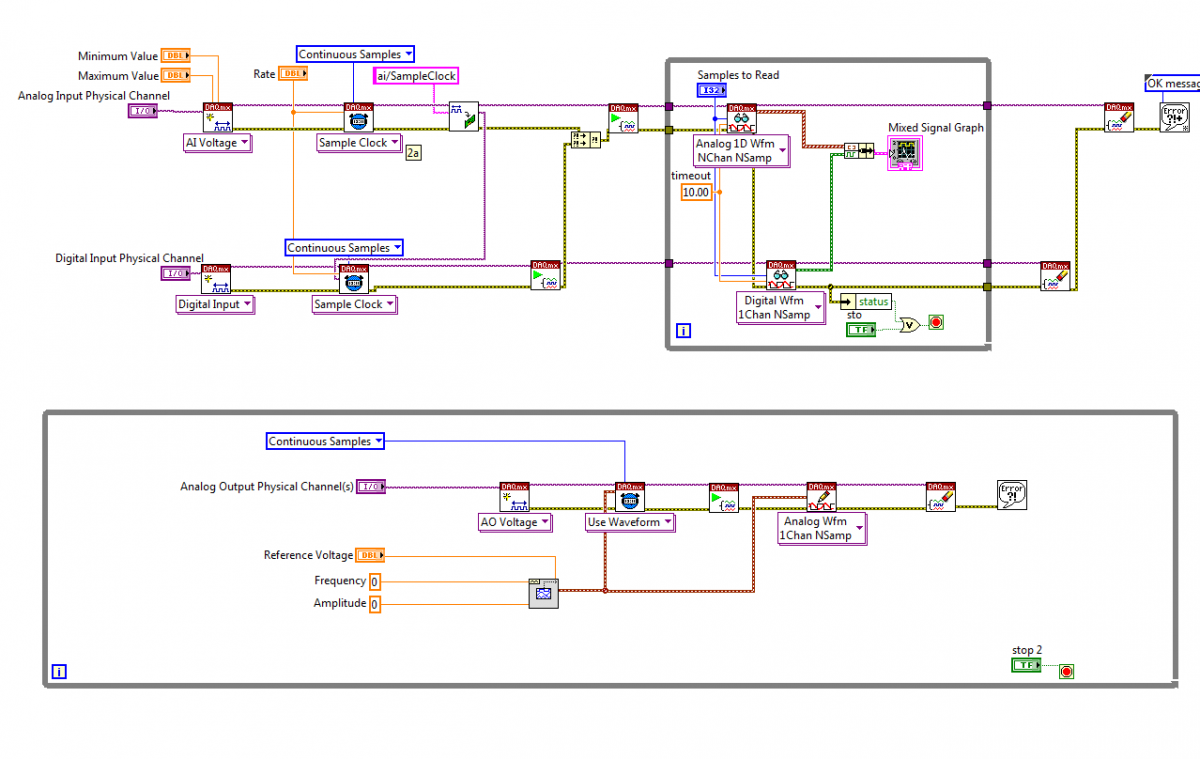
Hi all, I am new to using LabVIEW and I was hoping to get some help with the issues I am having with my VI. I am working with a myDAQ that I have set to produce an analog output and also acquire data from a digital and analog input. I am then graphing that data on a mixed signals graph, which is working properly. However, the two waveforms on the graph are not synced. It seems that the digital input is off by approximately 0.05 seconds and I'm not quite sure how to fix this. I've tried using two separate DAQs but this didn't make a difference. I also thought that maybe I needed to use sample clocks for each of the inputs, however when I try using a sample clock with the digital input I get an error. Does anyone have any suggestions on how to approach this issue? I've attached a photo of my current VI. Anything would help, thanks!