M.H.K
-
Posts
22 -
Joined
-
Last visited
M.H.K's Achievements
")
Newbie (1/14)
0
Reputation
-
Hello I have a .inf file as my instrument driver but I cannot modify it for Win8.1 and Win10. It generate with NI-VISA Driver Development Wizard version 5.3. Can everyone help me? Thank you in advance. opbox20f.inf
-
Hi I'm trying to track an object and I wrote a program for it but it doesn't work perfectly and loses object. I attached the program. Please help me. Thank you in advance. Tracking.vi
-
Hi MikaeIH and thank you very much.It's exactly my goal. I will try your example and if I have a question, I will say you. Thank you again.
-
Hi MikaeIH and thanks for your reply. I have a question about your help. How Can I draw a ROI in xy graph?
-
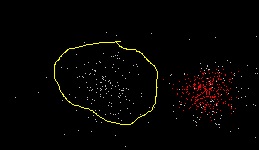
Hi I have a xy graph contains a number of points and I want to select a part of them similar to ROI and their colors be changed and also, we can select a number of ROI in that. please help me.

-
I dont want to change the color.I want to have a graph with a color without changing it.I prepare the graph for a color but after reducing the number of plot and then increasing them,color change.
-
Hi I want to have a graph with a number of plot ( such as 500 ) without changing color ( with a fix color ). In Labview,when you set a graph with 500 plot in a color and after that you reduce the number of plot and again to 500 plot,color change. How can I have a graph with a color? Thank you
-
,I have made this hardware for my laboratory and now I am trying to write its software with your help.
-
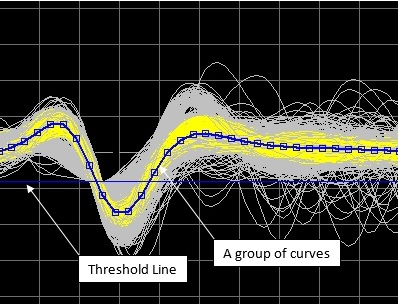
First,I receive my datas from DAQ with 8192 points, then I detect their picks and show 8 samples of before peak and 24 samples of after peak. So, I want to show at least 32 sample,not 8192 It is RMS of some set of the white traces.But we have a threshold with several templates that each of them shows firing of a neuron.
-
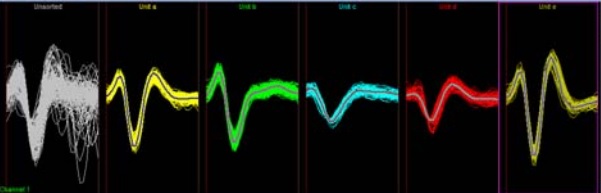
It was my first problem, and it is may goal : ----------------------------------------------------------------------------------------------------------------------------------------------------------------------------- what do you mean ? I have a threshold line that show on plot. In this picture,we have all of curves ( white ),a group of curves ( yellow ),a template curve ( blue that it is template of yellow curves ), and a threshold line ( blue ). And in this picture,all of curves have sorted in 5 templates that they show in different plots that the main graph contains all of them is: It maybe contains with templates curves or not that in this templates curves are hide.
-
Yes,they will display until meet the threshold criteria,as template curve has such condition. in my daq,FIFO size is 1024,and I read 8192 samples each time. I have to test it and I will say you its result.
-
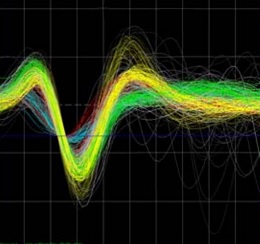
Hello It is good point. First,I wanted to overlay all of them,but ensegre convinced me that I limited their numbers. anyway,if you have a good idea,i will be happy to hear it. Can you explain more? I cannot use of way of "decimate the data for display".because I only have 30-50 data points for each of overlaid curves .you can see it and its source code in first post.
-
Hello Thank you for your reply. For this,Why should not I change their colors? And,how should I implement this "transparency"? Thank you, Is so good. But,why do you use of visible property and bbean use of defer panel updates?Which one is faster? Thank you so much
-
I think,I set it wrong. It is also about waveform graph. I am sorry.
-
Hello ensegre Those questions that I asked you, were about waveform graph. Have you an idea about it? Thank you