pktl
-
Posts
10 -
Joined
-
Last visited
-
Days Won
1
pktl's Achievements
")
Newbie (1/14)
2
Reputation
-
You found the solution! Actually, the Facade vi runs transparent by default. If I unselect 'Window runs transparently' in the Custom Window Appearance dialog, it works as expected. No workarounds using tab controls/background images necessary
-
Good point... I'm not sure. It's implemented like this: If this is incorrect, how can I get the reference to the actual clone?

-
Thanks, but that's not quite what I meant. I would like to change the color of the XControl based on the state of it. E.g. If True -> Set color green, if False -> Set color red. If I understood you correctly, by setting a transparent pane color, I just get the color of the frontpanel on which the XControl is placed. It looks like the pane color of XControls is a static property, not writable at runtime. However, I could not find any documentation on this restriction...
-
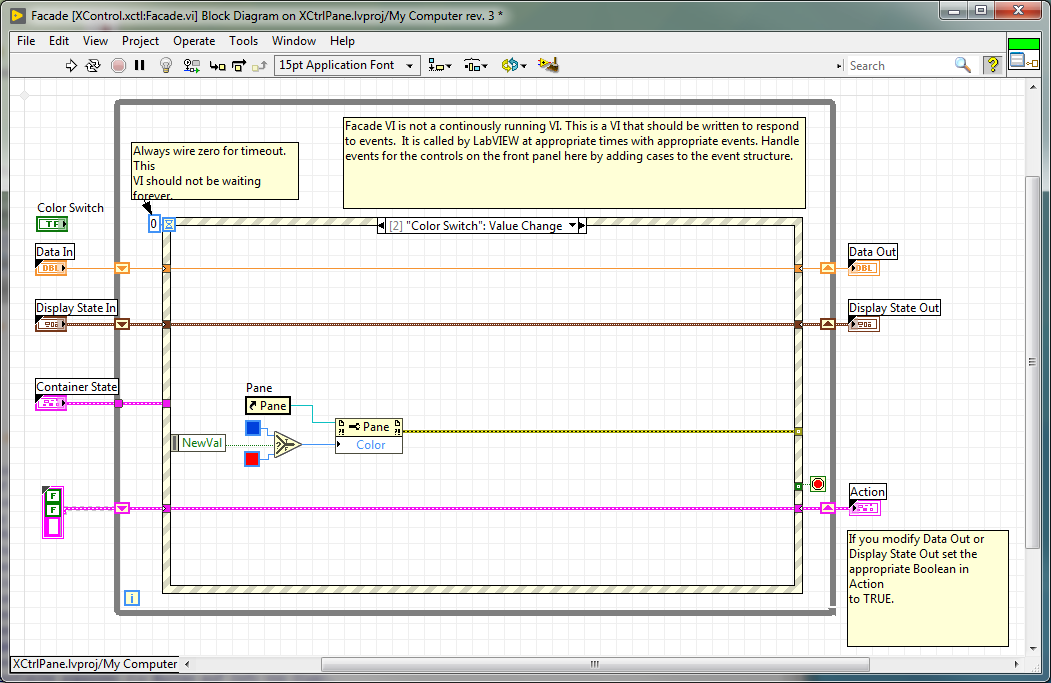
Hello everyone, I'd like to adjust the background color of my XCtrl by setting the Color property of the Facade vi's Pane. However, that doesn't do anything. Instead, I tried to set the color of a decoration in the background. That also didn't work. (Maybe because I'm accessing the decorations reference through the Facade vi's Pane?) My current workaround is, to place a picture indicator behind the other controls and load an appropriate png file. That seems extremely inefficient, so I'd like to avoid it. Do you know of any documentation of this limitation regarding Pane properties of XControl Facade vi's? Is there a more efficient way of changing the background color of my XControl?
-
Popup warning when using Set Source Scope
pktl replied to pktl's topic in Object-Oriented Programming
I could have sworn that the same popup also appeared when I tried the 'Set Scope' method... 🤔 But you are right. No popup when using it instead. Actually, for my application, using 'Set Scope' is probably good enough. Nice! Can you estimate if and when it's released? -
Popup warning when using Set Source Scope
pktl replied to pktl's topic in Object-Oriented Programming
Thanks AQ. After posting here, I also opened a support ticket. I guess, I can close that now. By the way: NI's Unit Test Framework seems to work even with private methods. One can see the access scope changing in the project when the tests are running. At a cursory glance, the UTF is just 'regular' LabVIEW. So I wonder how that works or what the workaround is. -
Popup warning when using Set Source Scope
pktl replied to pktl's topic in Object-Oriented Programming
Thanks for the advice. Unfortunately it doesn't work with this dialog box. Maybe I have to resort to some mouse click simulation tool. -
Hi, I want to unit test methods in my classes using JKI's VI Tester. Some methods are private or protected, which means, the TestCase class can't access it. (Yeah, I know, testing private methods is controversial for some people, but I want to do it anyway 😛.) My approach is, to save the access scope of every vi in the class that I want to test. Then set all members to 'public' in the test setup and finally restore to the original setting in tear down. The problem is: Everytime the 'Set Source Scope' or 'Set Source Scope And Propagate' library method is called with a dynamic dispatch method, a warning pops up. This requires me to click a button, which I wanted to avoid in the first place by programmatically changing the access scope 😬. My question: Is this dialog suppressable or automatable somehow? At least 'Set Source Scope And Propagate' should not result in a popup. Its sole purpose is change the scope and propagate that change. (Generally, calling invoke nodes shouldn't popup anything, IMHO.) I could also set the access scope to 'community' and add the test classes as friends, but that seems like an ugly workaround... Edit: By the way: I'm using LV 2018 SP1, if that makes a difference.
-
Hello everyone, I encountered an error that only happens when running my application as an executable with actual hardware connected. So I compiled the executable with the debugging enabled and set the vi server's port to 3371. I can discover and connect with the application just fine with both LabVIEWs built in "Operate - Debug Application or Shared Library" and desktop execution trace toolkit. But: Debugging is extremely slow to the point of being unresponsive for 10s of seconds. When probing a wire, the probe window doesn't update after some seconds. When using DETT, it just blocks for 10 seconds or more before it receives anything and doesn't update properly as well. I'm connecting through a dedicated 1 Gbps wire. There is only one router in between and nothing else is connected to it. So hardware shouldn't be an issue. Do you have any ideas what might cause this? Edit: The remote machine has two network adapters. Connecting the other one fixes the problem... 🤔
-
Hello everyone, thank you for these probes. They make debugging much more enjoyable One question, though: Is there a way to make them work in a debugging executable? The debug session crashes as soon as I select one of your probes. It makes sense, I guess, since probes are not recognized as a dependency and are therefore not included in the build. Is it enough to add them to the 'Always Included' list? If so, which files exactly are necessary?