

Lipko
-
Posts
110 -
Joined
-
Last visited
-
Days Won
1
Content Type
Profiles
Forums
Downloads
Gallery
Posts posted by Lipko
-
-
1 hour ago, Rolf Kalbermatter said:
More than one per state? No.
Sad.
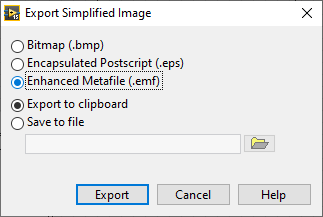
But: if you have a picture control and draw stuff in it, export the image as .emf to clipboard, then import it to the control state, it works. The image is vector image, so it will look good when printing.

-
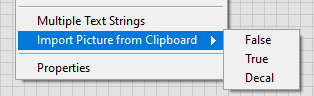
Loosely related: is it possible with some hack to copypaste more decorations to a boolen control true or false state?
-
15 hours ago, Rolf Kalbermatter said:
There are many ways you can print and it is not entirely clear to me which one you use. If you use the method to have LabVIEW send a front panel to the (default) printer, what really happens is rather involved. LabVIEW has no idea if the printer is a real printer, using EPS, LPD/LPR, JetDirect or whatever else underlaying printer driver protocol. All it knows is that the printer driver supports a GDI interface (The Windows Graphic Device Interface specification that is also used to draw items on the screen) and it pretty much treats it exactly the same aside from some extra setup steps such as page size and orientation. What finally ends up on the printer is very specific on the quality of the printer driver and its ability to render each of the zig hundred GDI commands properly in a resulting output. It seems that the PDF printer driver you are using, does some shortcuts by not rendering everything itself but for instance letting rotated text be rendered by the Windows GDI subsystem itself and then reading the resulting bitmap and adding that into the PDF stream. A very valid procedure although of course not the highest quality result.
Other PDF printer drivers may be a bit more developed and translate this properly into direct PDF commands, but they may cost something.
Thanks for the comment and also the info about the GDI thing. I have a small issue with dashed lines appearing solid or very dense when printing (yes, I use the printer method) also present in DiAdem, and I will research if it's also related to GDI.
Edit: no, it's the printer that's causing the linestyle issue.
-
Thats very nice, thank you!
(there a typo: 3D valves should be 2D valves.)
-
Hmm, that print to PDF method is pretty amazing, I wonder why it seems so unfinished (rotated texts become bitmaps, overlapping things may or may not become bitmaps, etc)
So: maybe everybody already knew that, but picture controls are actually vector based. Lines are pretty, smoth vector lines, texts are texts that will be selectable in the pdf, etc. I'm shocked....
-
Okay, I made an easy fix, I wonder if this thing will occur again.
So: simply keep only the curve data that's inside the x scale range.
-
Hi all!
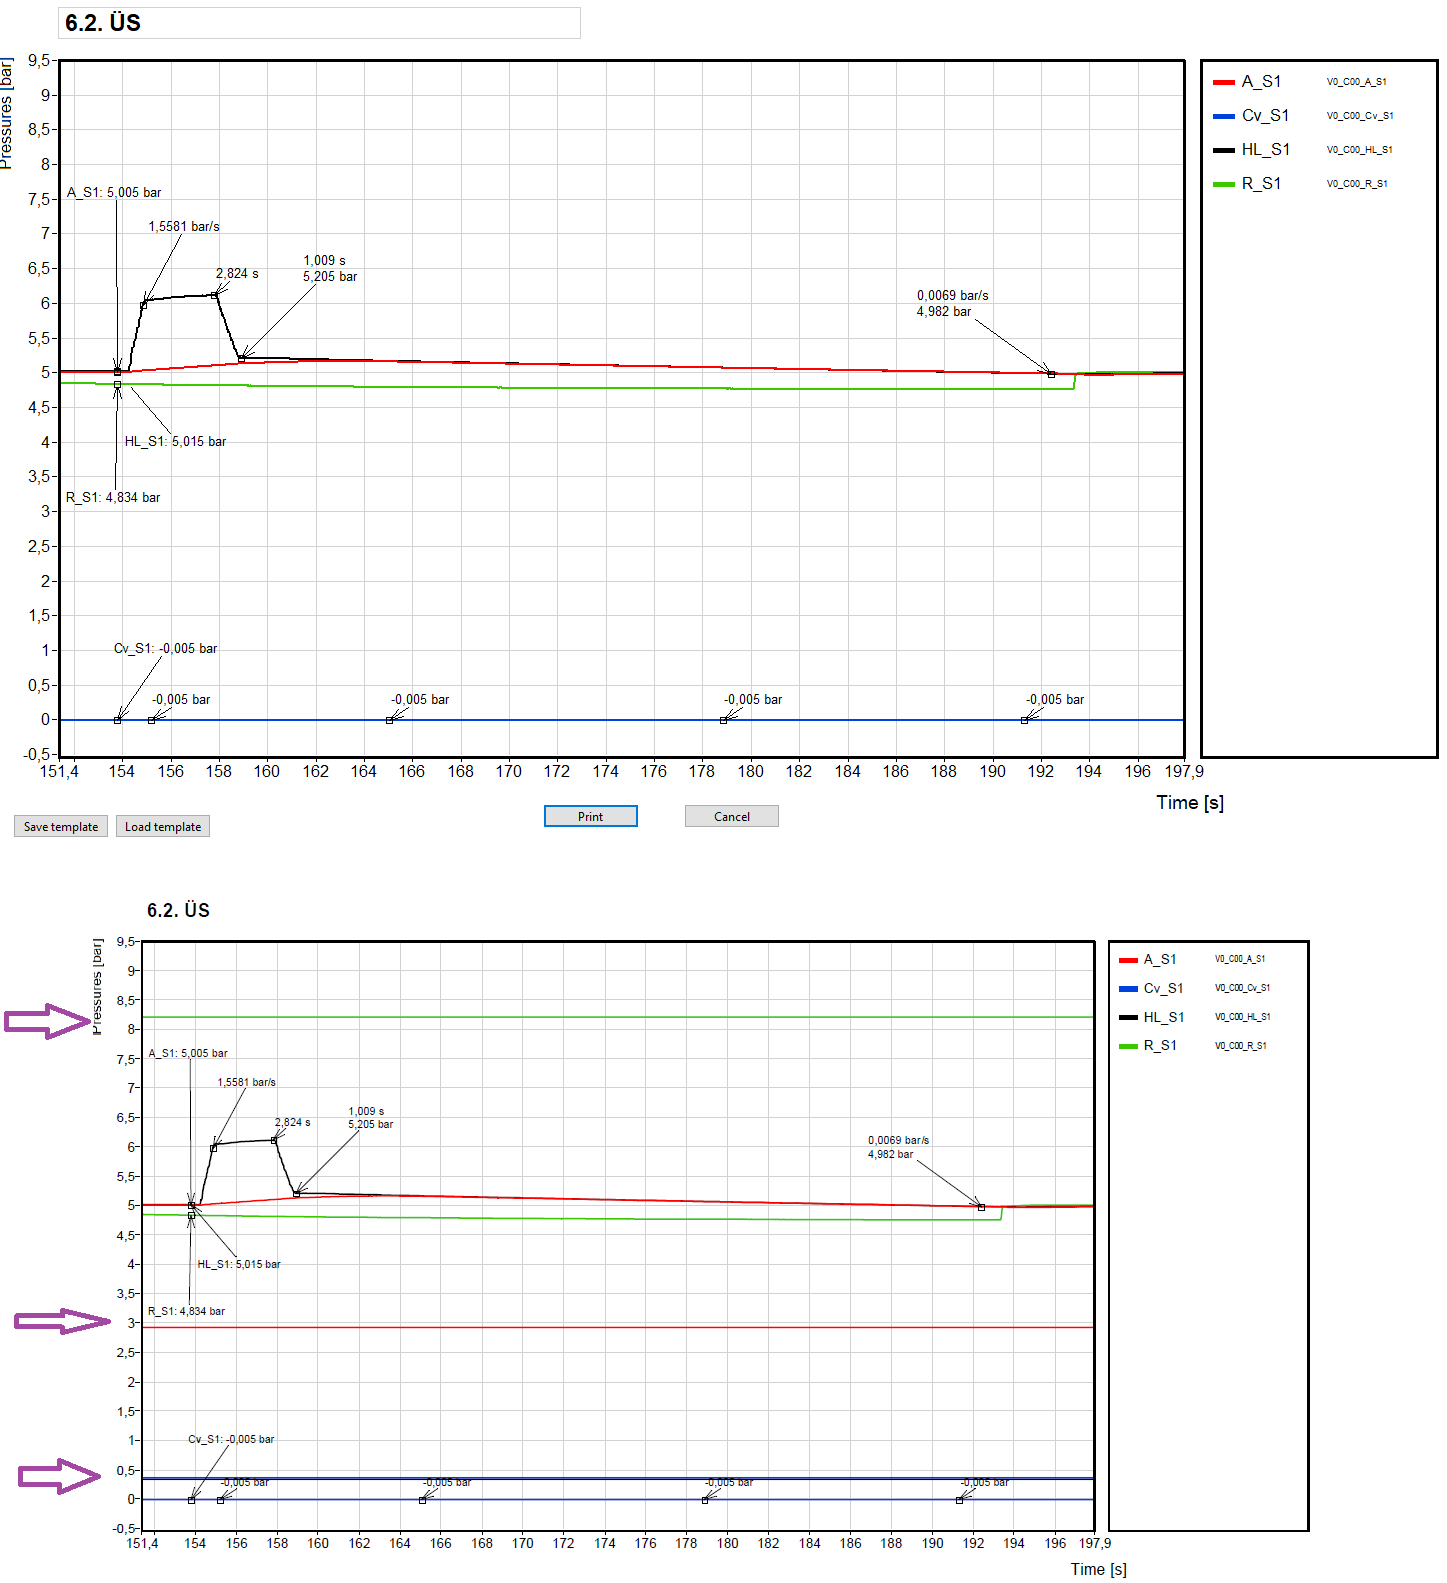
I started using the panel to printer method because I needed high quality pdf output of the front panel. It works okay apart from rotated strings, but I encountered a strange and pretty bad artefact. I have a graph on the front panel, and under some circumstances, "constant" lines appear on the graph in the generated pdf, see picture below (top: the front panel that is to be printed, bottom: the generated pdf). On the front panel itself, I don't see anything strange, no artefacts on the graph. This happens about 2 times per 15 prints. The graph data and everything is always the same, the only difference is the X scale range. I can set a range when the artefact wanishes. For the example below, there's no artefact with X scale set to 150... 210.
I don't know where I could screw up and what, or is it a known bug (2015 sp1)? If it's a known bug, is there a workaround?
Thanks for any hints in advance!
-
The problem is not clear to me. You want to parse the string or do something else with it? Why wouldn't a simple scan from string work? Or do you want to forward the message? How fast should it be?
-
3 hours ago, Rolf Kalbermatter said:
Supposedly it is not using user input to add to the internal knowledge pool beyond a single session. Of course it's tempting to do that anyhow. It uses a lot of energy to run and somehow some bean counters want to see some form of ROI here, so "free" learning input would seem interesting. But without a very rigorous vetting of such input, the whole knowledge pool could easily be tainted with lots and lots of untruthiness. Not that even the selection of the actual training corpus for each new training round is guaranteed or even likely to be not biased in some ways either.
Some noise is good to prevent overtraining. People recieve lots of random info and intelligent people still can get around.
We have reached the point that God only knows how the info is digested by this AI thing. (for example a user asks something and the AI can google some interesting new keywords it didn't encounter much yet. The info it reads from the web is added to the pool...) -
10 minutes ago, Rolf Kalbermatter said:
Your time scale definitely seems skewed in terms of the grand scheme of the universe and all that. 😁
Or did you mean to write Atoms instead of Eons? 😎
I consider ChatGPT and friends still mainly a fairly advanced parrot.
The parrot is improving with every quiestion. I can only guess how many millions of questions it gets every day. So 1-2 months can mean eons.
Or maybe I just fell for all those alarmists... -
Eons have passed since the last reply. Any new experiences?
I just had GPT make me some C code calculating geomerty stuff and it did well (not a perfectly full implementation but the harder parts worked fine, saved me an hour or two).
But it surely doesn't know what Lego Technic is. Um.. that was last week, maybe it has improved in the topic.
-
The sampling frequency must be at least twice the signal frequency that you want to measure. But it's better to have higher sampling that.
https://en.wikipedia.org/wiki/Nyquist_frequencyIf it was obvious, then sorry.
-
The result of one "Select" should be the false input of the other "Select". The order should not matter.
-
If you don't want the user to change plot styles/point styles etc, only the color and the label, than you could also use an array of clusters with the color, label and visibility settings. Or anything else you want, like highlighting one or more curves (thicker line).
-
You coud use PloImages (property of a graph) for that and use picture functions to render and position the labels. There are three layers: back, middle, front. One problem though (which seems more like a bug then a feature) is that cursors are in front of the front layer, thus the labels. I don't know if it's a problem in your use case.
I use plotimages quite a lot recently, they are good for having color background sections/stripes (which are behing the grid) and for filling graph areas that would not be possible with plot fill. It involves a lot of "map XY to coordinates" but with some optimisations (for example scaling the values to pixels "manually" without "map XY to coordinates", and only calculate the scaling factor and offset with "map XY to coordinates" when the scales or plot area changes).
-
Or maybe do some hobby projects in areas you don't have experience yet but are interesting?
-
Hi all!
I have a bunch of outlook message files (.msg) and I would like to open them, get the unformatted text content and open the attached file.
I think it should be a fairly easy task but I haven't found relevant answers on the internet yet. I found ways to interface with outlook, but those are overkill for such a task and I haven't looked into them yet.Thanks for any hints in advance!
-
I think you should show all cases, maybe you would get replies from people you are not able to try your code at the moment (like me). We don't see where/how you set states apart from "4 - Display".
-
Or maybe and functional global variable? And store the refs and other future internal data there. This would be too cimplicated if you want to handle more "instances" of your camera functions though.
-
 1
1
-
-
20 hours ago, drjdpowell said:
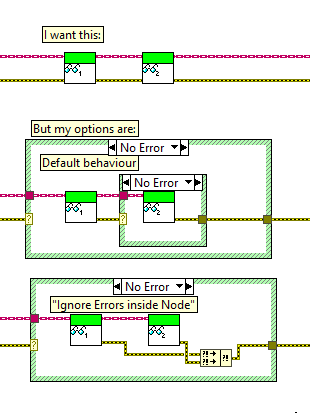
I diagram I made in another conversation, illustrating the issue:
I don't quite understand these. Do youn mean the problem is that the a read function duesn't use the error input in a sophisticated way other than "if error then return that error and do nothing" or "do the task regardless of error and merge error with the input error"? The latter is bad, but what's the problem with the previous in a general case?
What do you mean by the "I want this" row? On the caller VI level the insides of the read functions could be anything, including the two bad examples below that row.
Sorry for OFFing, error handling is a very interesting topic and so far all error handling I've seen was "chain every crap which has error terminals even ones that will never produce error into one God error snake" from even people hired as LV architects.
-
1 hour ago, infinitenothing said:
I think either of those ideas would be superior. The graph should have a plots property that returns an array of plot references. We see this architecture with things like tabs having an array of page references. An invoke node that didn't force you to do a write when you only want to do a read would also avoid this problem.
Yup, I mentioned the reference thing too. With reference array you of course have to do explicit array indexing and wire the reference all around, I don't see much improvment. It's just personal preference
-
24 minutes ago, bjustice said:
I would really like to know the answer to this question. I would expect the answer to be "yes" since property nodes all run in the UI thread
I remember it's stated somewhere. And if wasn't that way, that would be a horrible pattern.
-
I don't see how should Labview know which plot you intend to work on and what different method there could be. Sure, the above example should be easy to figure out but it's easy to come up with funkier situations. Maybe each plot should have its own reference, but I don't see that a superior solution. Or maybe choosing the active plot should be forced (invoke node instead of property node)? That's not too sympathetic either.
This pattern is far better than having an array of sub-property clusters and to manipulate those arrays. Though I agree that all these types of properties should have array version too, like graph cursors and annotations for example.
I often do ugly hacks with graphs and this problem never really got me. The code in the original post (I don't understand as it has some new blocks I don't know) seems like the model-view-controller is not separated enough.
-
I managed to solve it with some thinkering.
I used 3rd order Bézier curves to interpolate between neighbour points. The tangents in the points (which are the other two control points of the Bézier curve besides the end points) is calculated by the angle bisector of the two adjacent segments. The length of these control tangents are calculated from the length of the corresponding segment multiplied by a fix value ("strength"). Though it could be easily changed to have a separate strength value for each point.
Implemented closed and open version of the curve.
Note, that for some reason I havent looked into yet, the curve or some sections of it can suddenly snap into a seemingly opposite winding after a certain amount of deformity. The curve looks okay for my needs so I don't think I will fix that any time soon.
Attached a small quick demo. curve_through_points_demo.vi
The Bézier functio is also my "work" (copied the code into a formula node), I'm surprised that these basic geometry stuff are not implemented in Labview. by default
2D_curve_through_points.vi 2D_3rd_order_Bezier_curve.vi 2D_ccw_angle.vi 2D_3rd_order_Bezier_point.vi
Where do y'all get your (free) artwork for UI elements?
in User Interface
Posted
Sometimes a text is better than an icon. In your case coming up with a descriptive icon is quite tricky and the words would be also short, so maybe better to use words.
Anyway: I use paint in many cases and design my own icons. It's a nice way to get away from coding a bit.