

Yean95
-
Posts
12 -
Joined
-
Last visited
Content Type
Profiles
Forums
Downloads
Gallery
Posts posted by Yean95
-
-
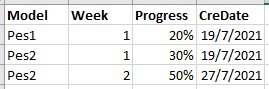
Hello~ I have this database as above in which users will key in the progress by weekly. However, sometimes they do not have any progress on that week so they will not key in through my system.
So my question is how do i make the system auto insert the next week progress same as the previous week when users do not key in their progress?
FYI, the weeks are calculated from the day when they first keyed in the progress for that particular model.
Below pictures are what i have done currently and I would like the system to auto insert the 20% for Pes1 on Week 2. Anyone know how to do that in LabVIEW?
Thank you so much for your help !!!
-
1 hour ago, Neil Pate said:
Can you post what you have done so far?
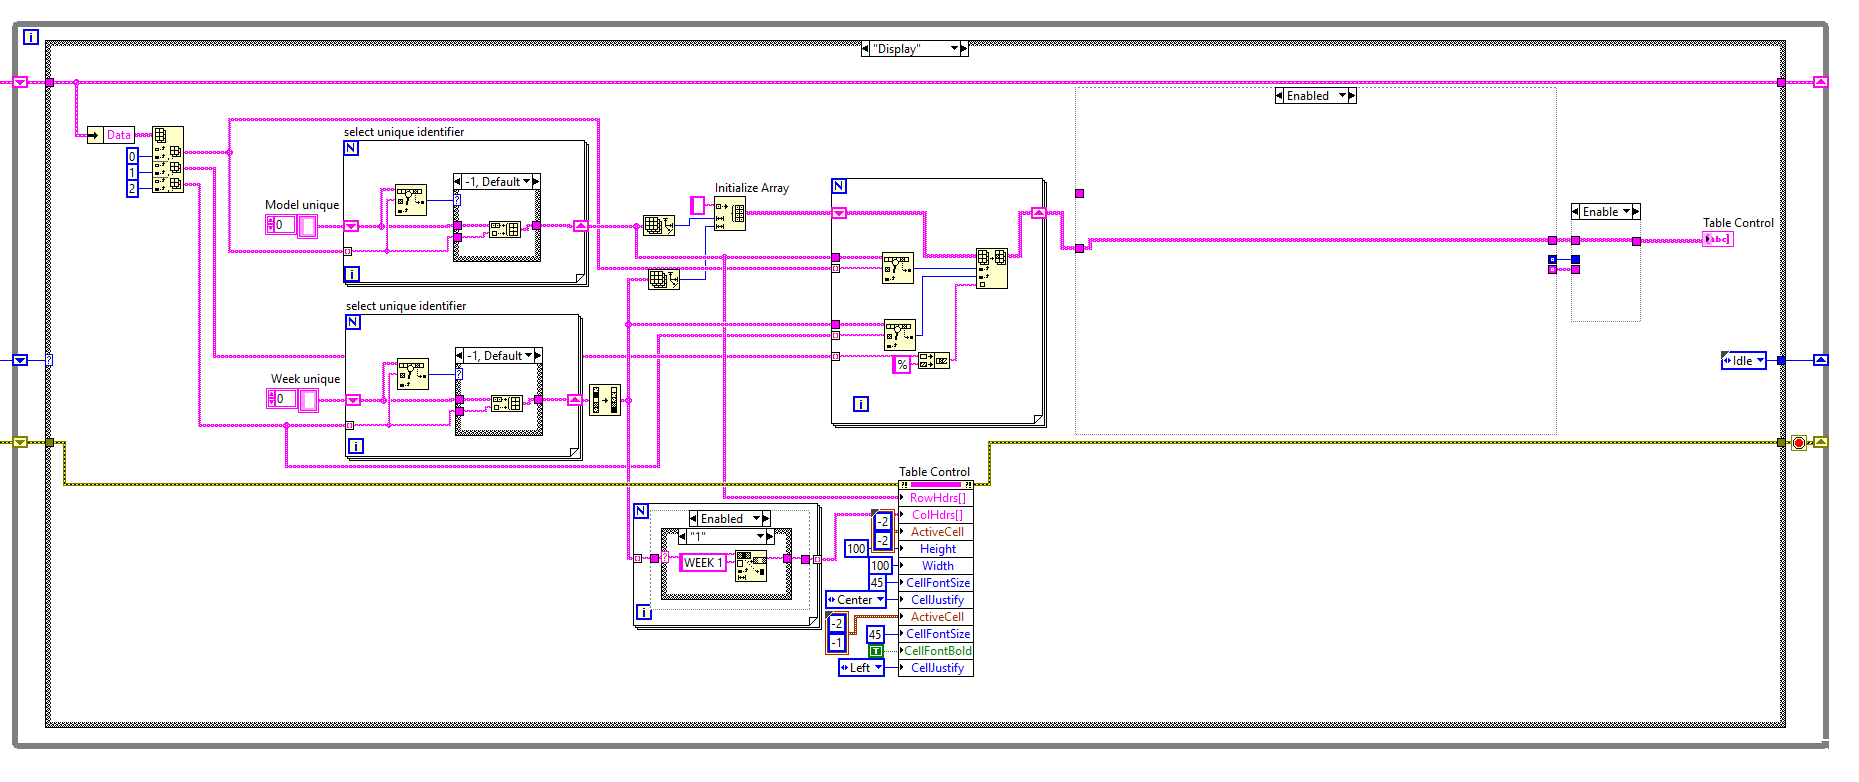
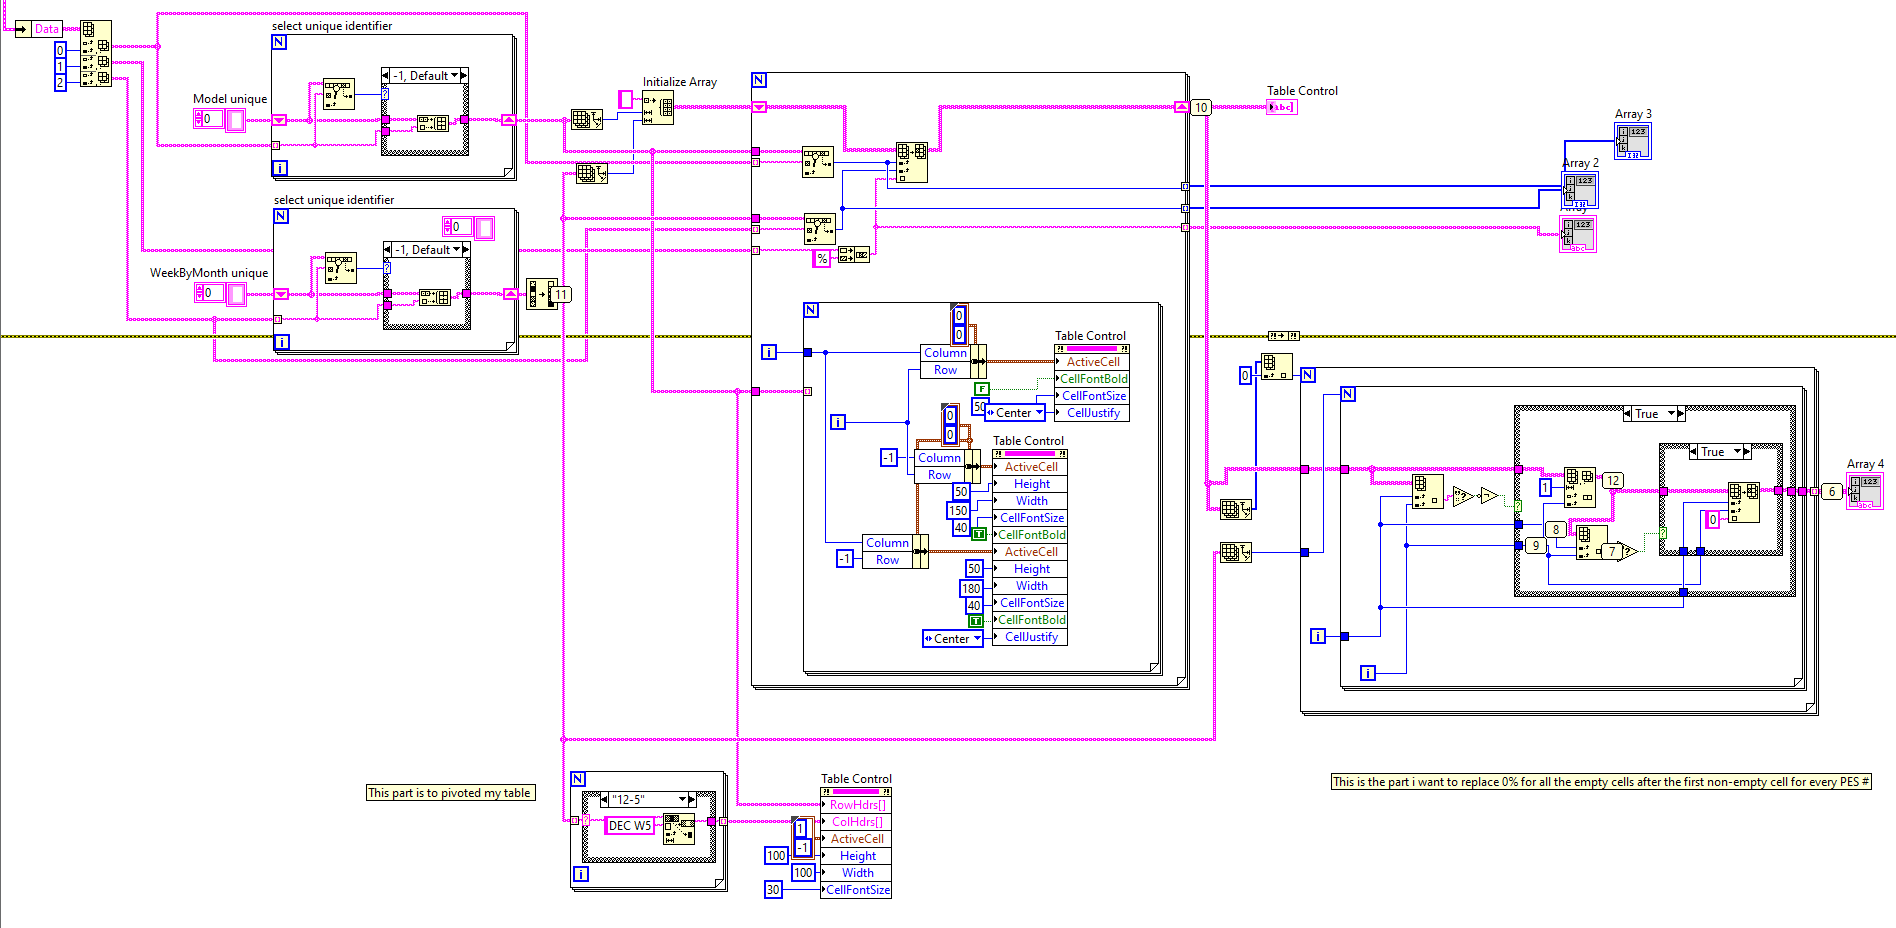
Below is what I've done but it's quite messy though. My original table is a non-pivoted table, so the front part of my labview gives the result of the first table in which the table is pivoted.
The last for loop is where I'm stucked.
-
Hello ! I've been trying to solve this problem for two days and I really need help on this.
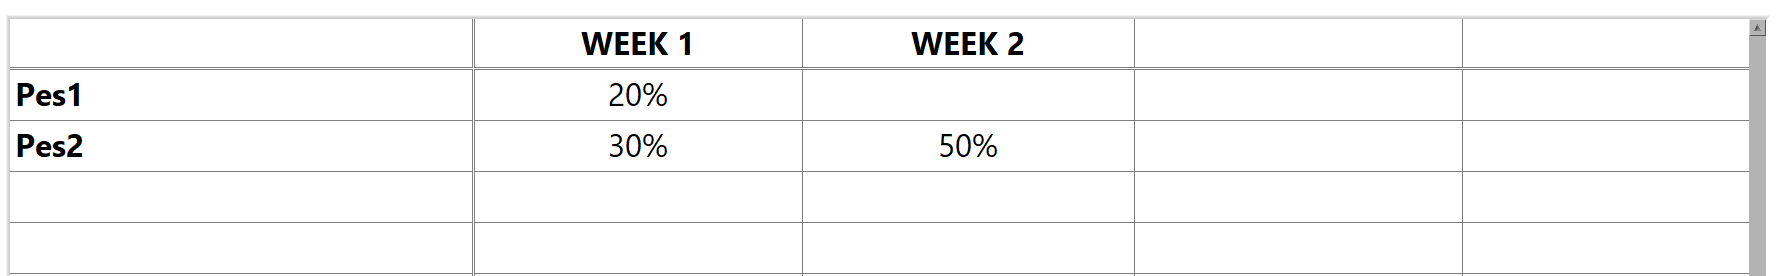
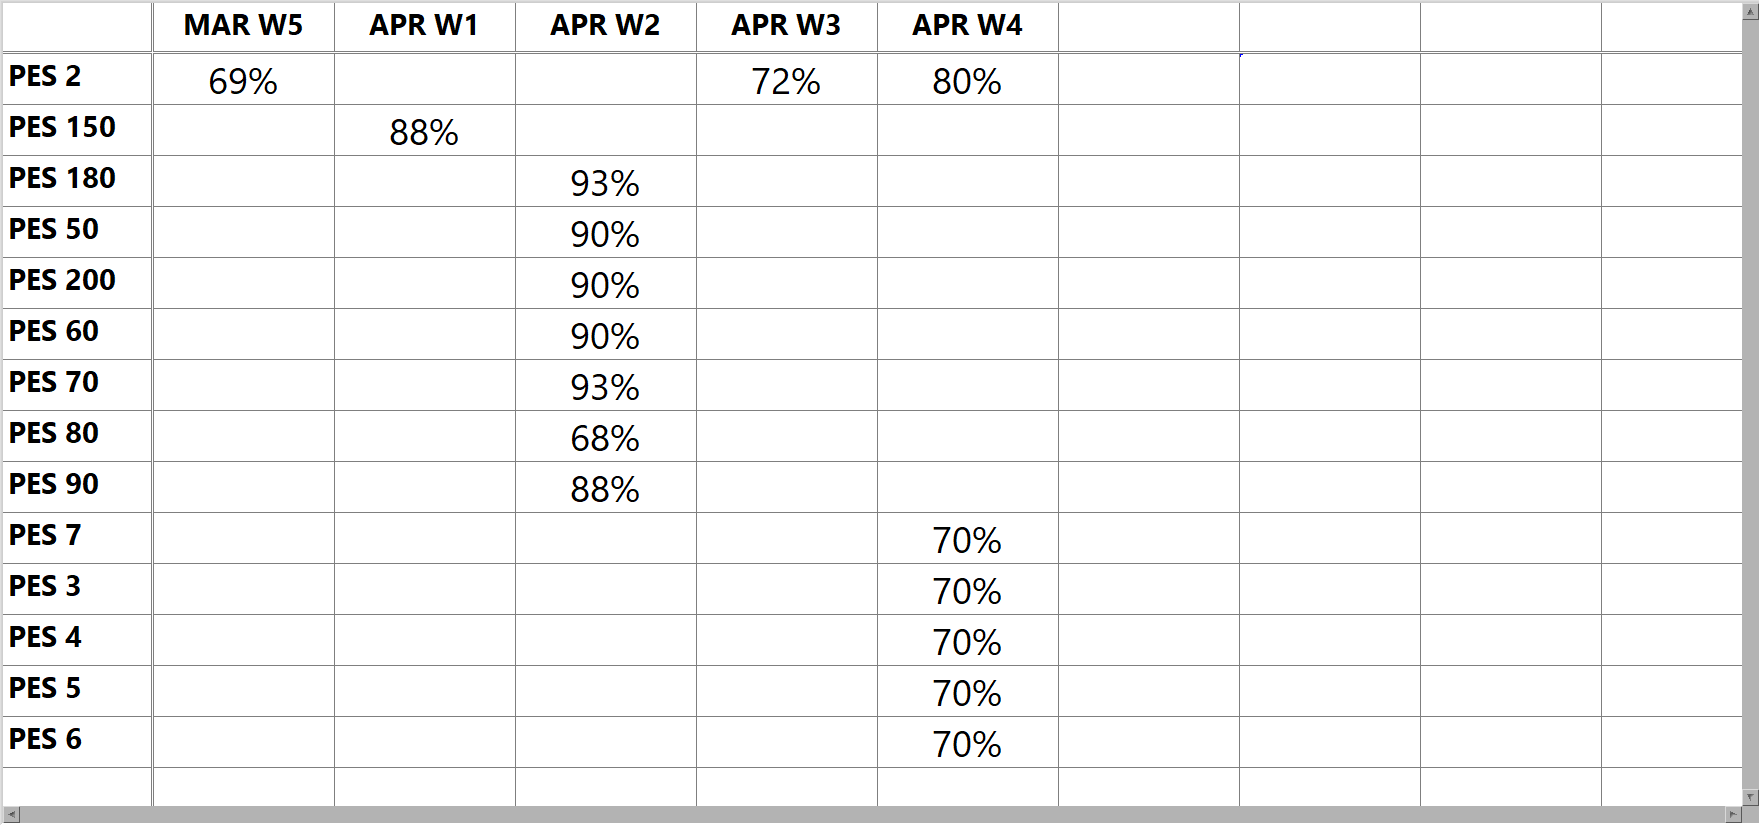
So I have a weekly progress table as below :
As long as there's already a non-empty column for the PES #, the rest of the empty column after that non-empty column needs to show 0%. How should I do this?
I need to make it into this table as below:
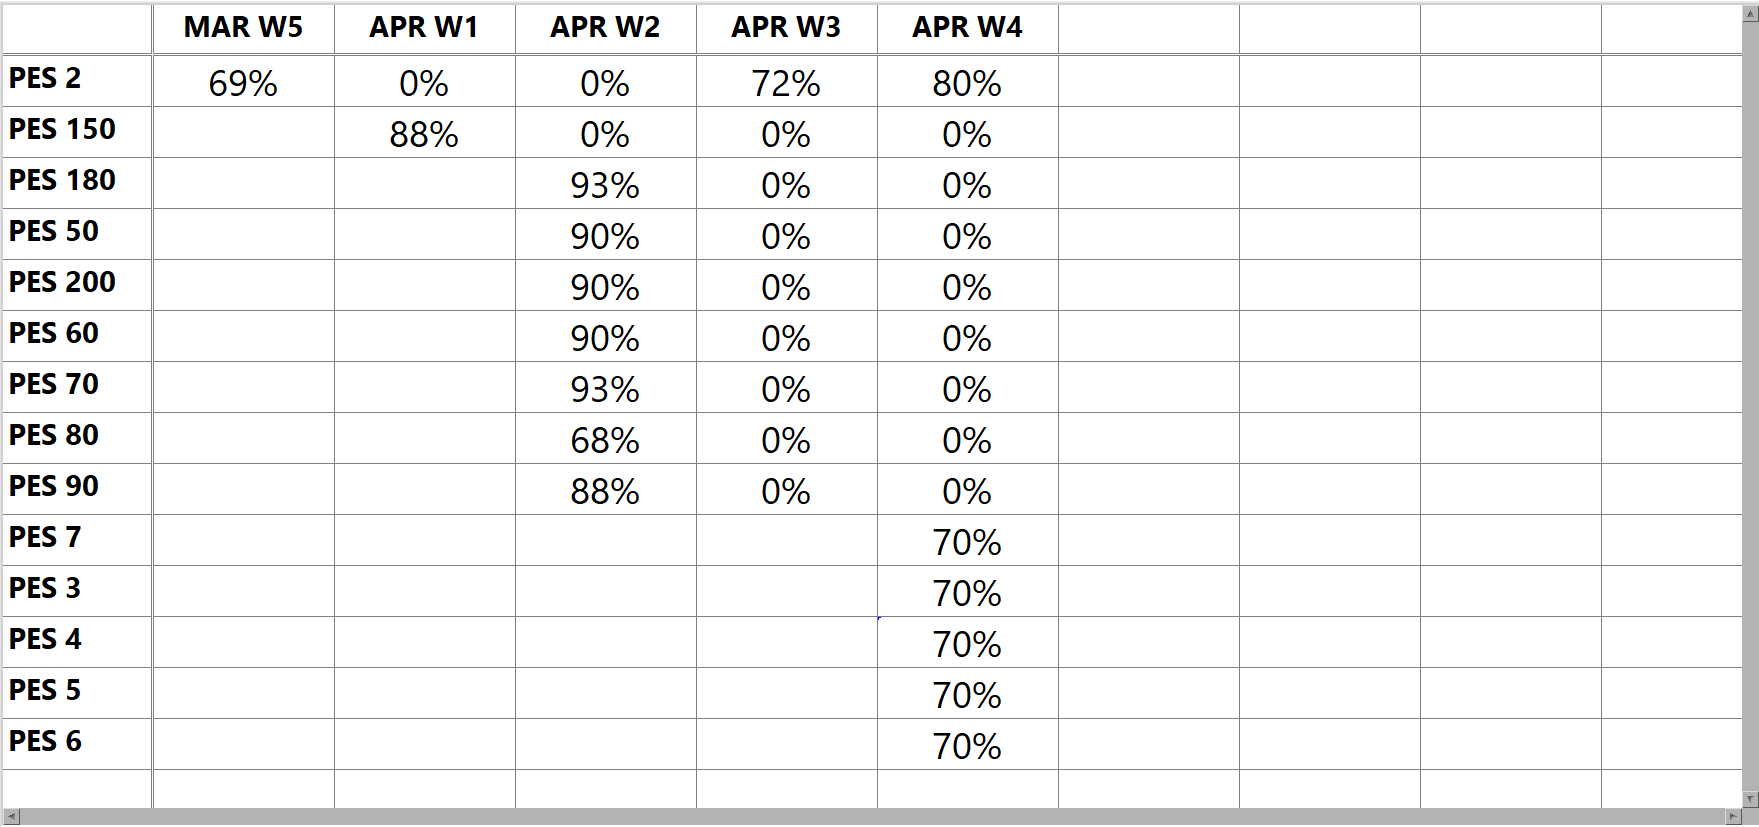
Thank you so much in advance !
-
cannot also, mine is 2015 version.
33 minutes ago, MikaelH said:Is 2016 okay?
-
Hello MikaelH,
Could you post the screenshot of the labview code? Cause I couldn't open your file as my labview version is older than yours.
Thank you so much for your help.
12 minutes ago, MikaelH said:You can do something like this:
-
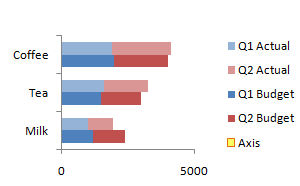
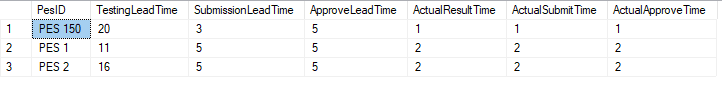
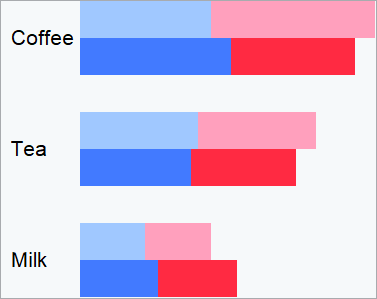
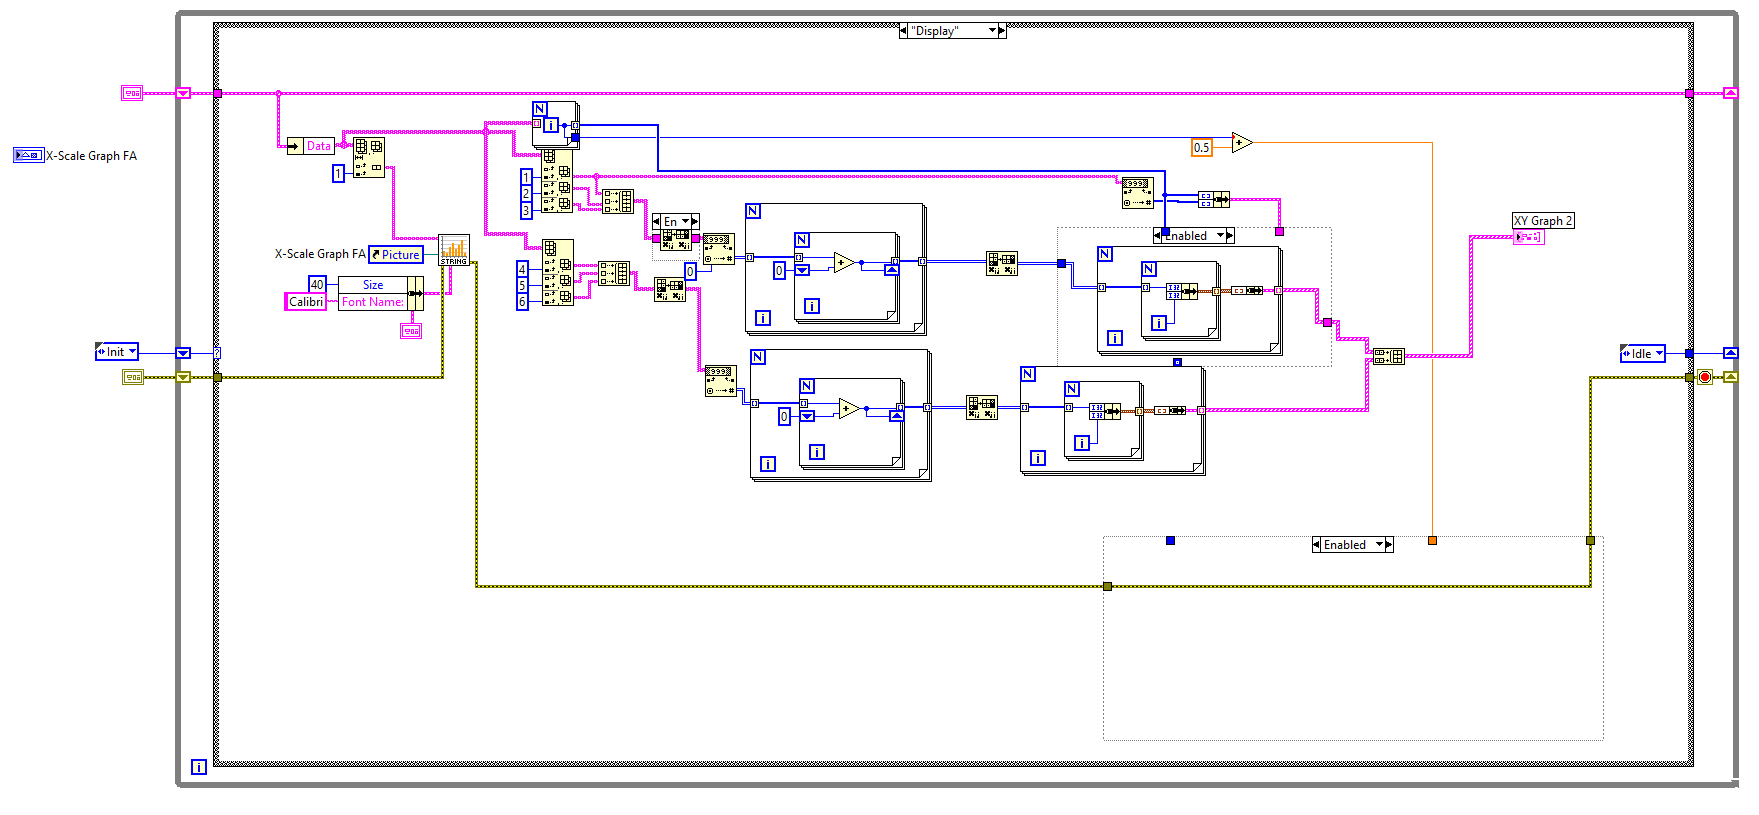
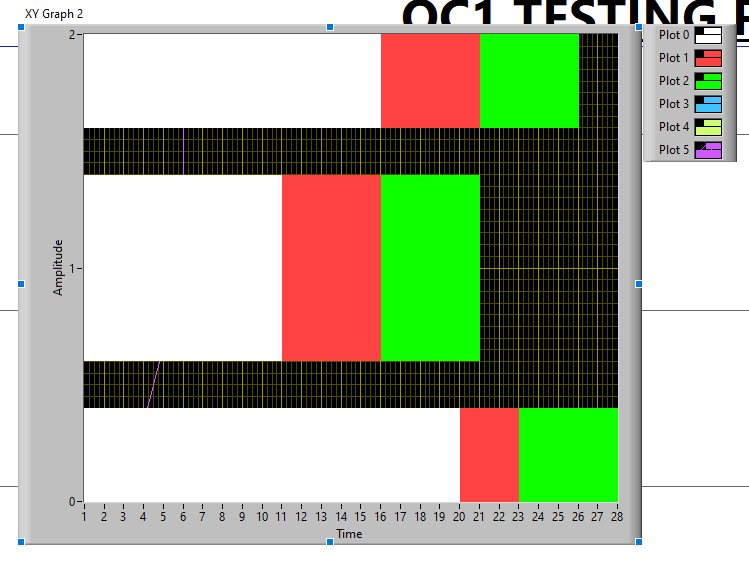
Hello! I'm having trouble to do this horizontal grouped stacked bar charts in LabVIEW as shown in first picture above and I tried to search online but I can't find any solutions for this.
As of now, I have successfully did the horizontal stacked bar charts for one category only (TestingLeadTime, SubmissionLeadTime & ApproveLeadTime), but i can't do it for grouped category. The second picture is my data while below is my LabVIEW coding and also the current result. Anyone knows how to get both my LeadTime and ActualTime as a grouped stacked bar charts?
Thank you so much in advanced.
-
1 hour ago, smithd said:
If you don't need to use labview, I recently used this tool:
https://github.com/glexey/excel2img
You can run direct from the command line or build it into an exe using pyinstaller.
Sadly I must use labview. There's other program that needs to be combine together with this.
-
1 hour ago, Gribo said:
The Excel .NET API behaves better with LabVIEW than the ActiveX one. From your point of view, they are the same, so why not use .NET?
I've never use .NET and this was originally done by my senior. I will try to use .NET now. Thank you !
-
10 hours ago, torekp said:
Just a quick idea, I didn't try to run your code. But I doubt that Excel tolerates an index less than 1. Is it possible that the count of "Shapes" is 0? Is it possible that the Sheet Index was 0, which in turn causes the count of Shapes to be 0?
Nope, the sheet index i already set to 1 as default and the count of shapes is 1 as well. I actually debugged the exe, and the problem that i found is at the sheets invoke node. The output of item is 0 in exe while in vi, the output has a certain value. But i just don't know why is this happening.
-
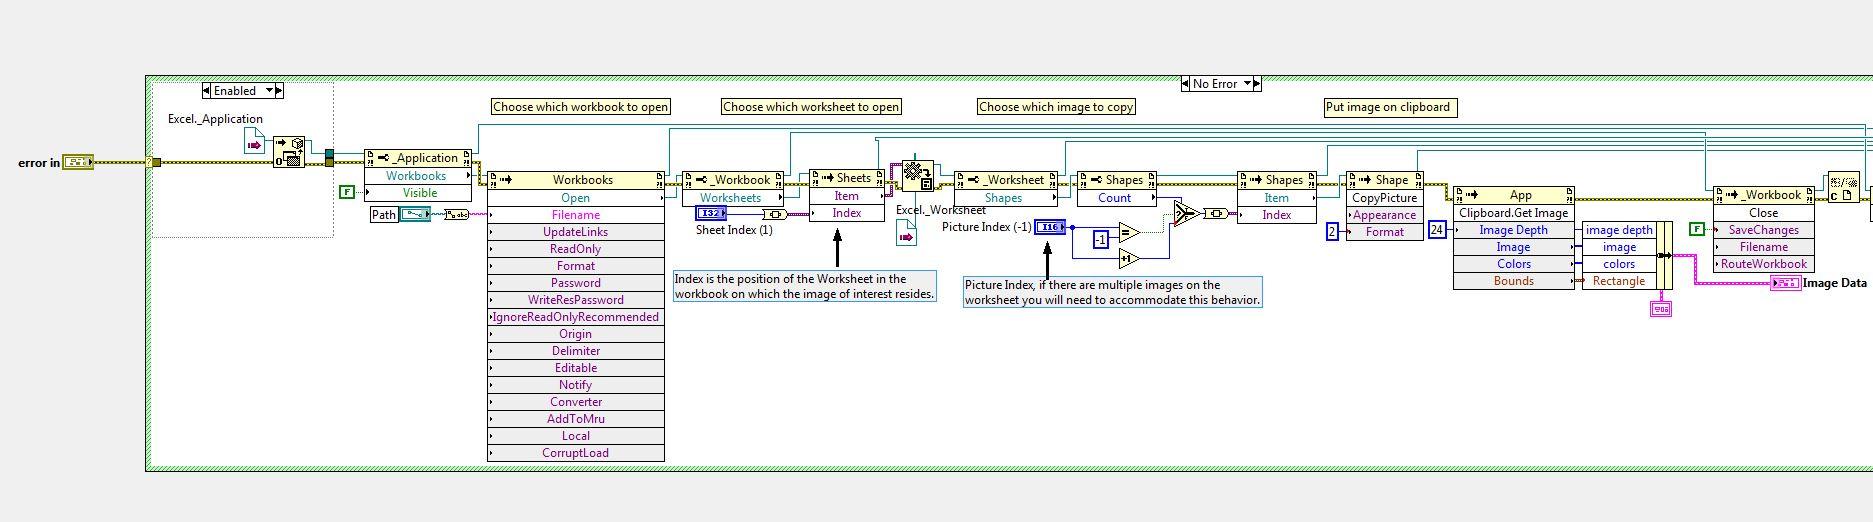
Hello, I'm quite new to LabVIEW and I've encountered a problem with ActiveX. I need to display the excel sheet as a picture and my vi runs exactly as expected. But when i build into the exe, the picture wouldn't display out. I've made sure the path is correct and there is no error shown for the exe. I also tried to debug and i found out that the sheets invoke node have some problem. The value that came out from item is 0 in exe while in vi, there's a certain value that came out. I do not know why is this happening. I've read other forums and tried to do what they had said, I tried to rebuild my block diagram and i changed the object library to Microsoft Excel 15.0 Object Library Version 1.8 but i still cannot solve the problem. Is there anyone who can tell me the solution? FYI, I'm using LabVIEW 2015 SP1 and our company just upgraded Microsoft Excel from 2010 to 2013. Does the version of excel matters? I've attached an image of my vi below. Thank you very much.
How to auto insert the next week progress when users do not key in manually?
in LabVIEW General
Posted
My intention is the first, I just want to fill the empty cells of the report table when users do not key in data. Can you tell me more about post-process loop? I don't really know what is that.
Thank you very much.