jpo
-
Posts
16 -
Joined
-
Last visited
jpo's Achievements
")


-
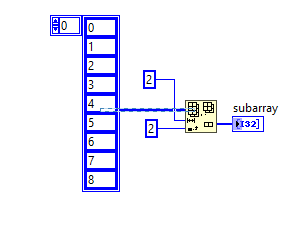
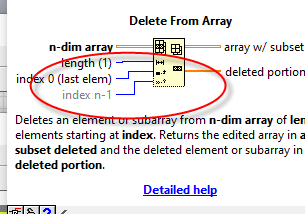
Stupid question. How do I make the delete from array take multiple items? I can not get the function to grow? Jpo

-
Looking for a example of UI with the main program able to open a floating pop up window which is used to displays a periodiaclly updated chart. All user interactions is done thru the main window and not the chart window. J-
-
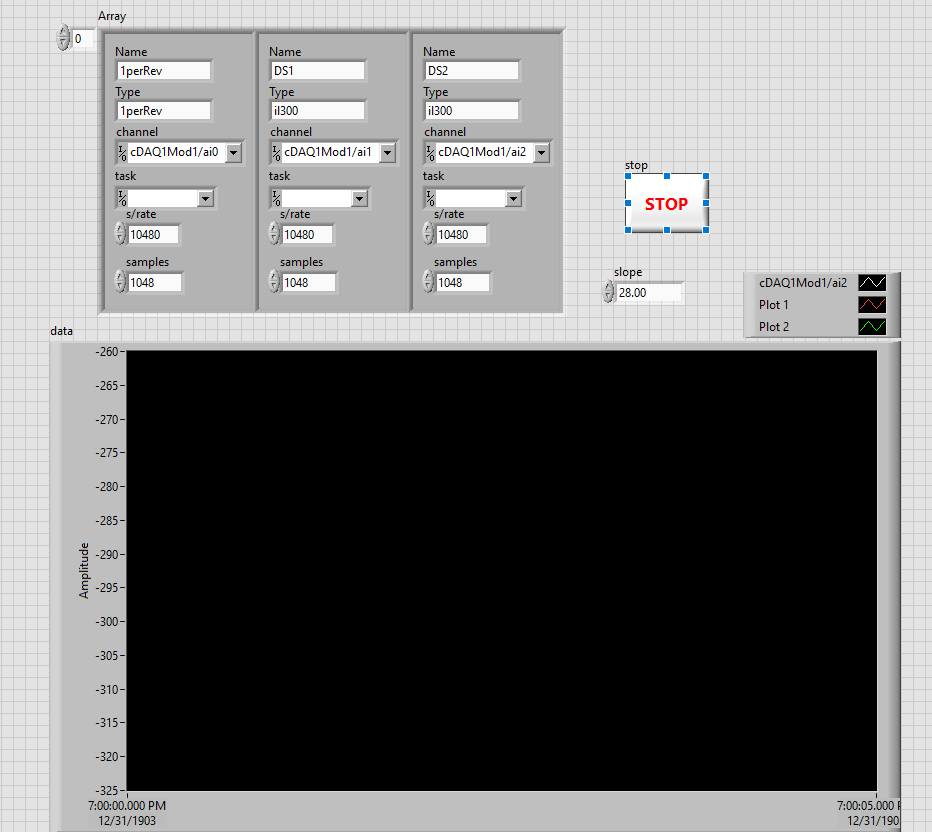
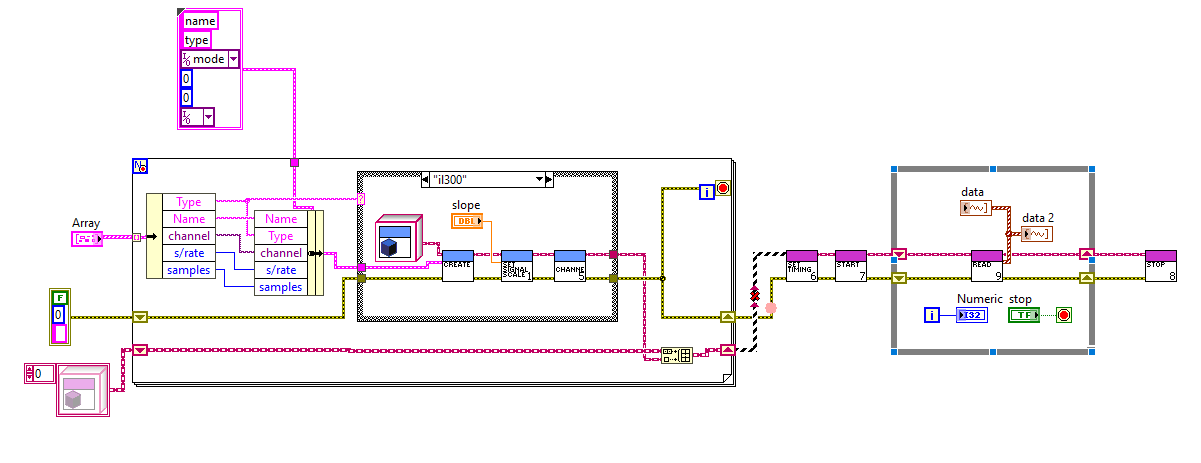
I am trying to create a general purpose cDaq program. It would be used for a variety of measurement types and would have an undefined number of channels. I would like to use objects. I am having trouble creating /grouping my objects together without out breaking wires. Any ideas on what I am doing wrong? Pics and project below. Thanks J-- cDaq_Objects.zip
-
Does a Labview vi pass is variable values bu value or by reference? J
-
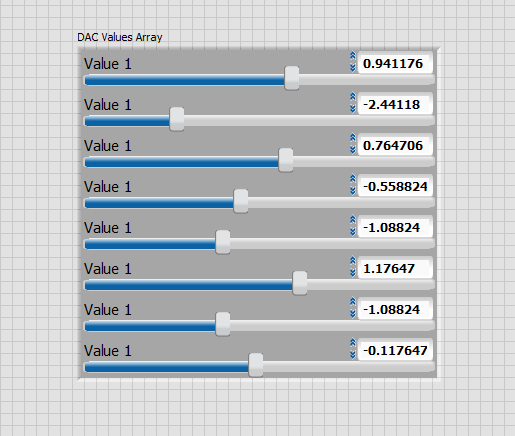
In my application, I have array of numbers. In the array, each value has the caption visible. Is it possible to programmatically change the caption names? I would like to see Value0, Value1, Value2, etc. John
-
Thanks for the insight. In my version, I display multiple points per channel per loop. Application records 120 channels at 2048 samp/sec so display every point is not possible. When I wire up the output of the array subset vi which is a 2 dimensional array, it will give me an error. Is there a work around? Do you know why this does this happens? Thanks John
-
Hi My application allows the user to change the number of input channels that a chart displays during runtime. When the number of channels vary the X Scale range values reset to zero for the chart. Is there a way I can stop this? I have include a simple demo program showing this issue. When the var number of channels is changed the X scale of Variable Channel Chart is reset. Thanks John ChartDemo.vi
-
[CR] Mark Balla's Icon Editor V2.7>= LV2017
jpo replied to Mark Balla's topic in Code Repository (Certified)
Thanks for the program. I have been using it for the last couple of days and have found it very productive. One suggestion for the next version would be able to add a library of standard icons that you could select from. The history of icons serves that purpose now but it would be great to be able to edit and control what is shows up there. John -
I tried out the comparision with App.Kind and it has worked successfully. Thanks, John
-
For debugging and testing purposes, I would like to be able to have my VI programmatically tell itself if it is running as a VI in the Labview development environment or if it is as a built application? Currently, I am using a simple case statement with boolean constant to control this feature. John
-
My project is starting to use tables and I have a couple of questions about controlling them in the front panel. 1.) Is there a way to make a labview table only accept numeric input into a table? 2.) In my example, the user can control the number of rows and columns. When they use this feature, the table size changes. Is there a way to disable this autosize property? Thanks John
-
Hi My application displays 24 channels of data in a chart. I have the update mode set to sweep. Is there a way I can change the color of the red line that precedes the new data? I have looked all through the property nodes of the chart buy have only been able to find update mode selector. Is changing the color possible? Could I get rid of the line all together? Thanks John
-
Hi In a waveform chart how is grid spacing defined? I have an application where the user would like to view the data without any grid lines 90% of the time. For ease of quantifying, he would like to be able to turn the grid lines on and off and be able define the grid spacing from the front panel. Turning the grid on and off is easy using the chart properties, YScale.MnrGrdColor and YScale.MajGrdColor. How would I go about changing the spacing of the grids? Thanks John
-
Yes, that is what I want to do with one change. Instead of being a Boolean data type being passed, it is a cluster containing controls and text. My problem is that the new subvi does not know how to access the property nodes of the text and controls that are in that cluster. Is there a way I can type cast the reference in the new vi to be able to access the property nodes of the items in the cluster?
-
Hi Michael, I am trying to modify the cluster of controls