Mahbod Morshedi
-
Posts
42 -
Joined
-
Last visited
Content Type
Profiles
Forums
Downloads
Gallery
Everything posted by Mahbod Morshedi
-
 Yes, I actually like the DQMH, but I haven't gotten used to it and am still learning. My goal is to rewrite all the apps in the DQMH framework eventually. I have a long way to go, though. Cheer, M
 -
Hi All, Thank you for all the help and helpful comments: 1 - You all were correct about redefining variant attributes. I realised that, and good god, it is easier to use. 2- For the polymorphic VIs, I appreciate the primitive data form of the polymorphic instance. However, I am a scientist in the lab, developing several software programs that facilitate the acquisition, display, processing, and exporting of data from various equipment and experiments. Since I am just learning all these tools and admittedly not a very good programmer, I occasionally make a tweak or add a new feature. Then I realise, 'Oh well, I need this extra data cluster for backup data, and it has to be labelled...' In cases like this, a new data wire is created, and it is too much of a hassle to go back and fix things, add a new terminal, or change VIs to deal with this new data type or to accommodate this new wire. That made me look into variants and consider a single wire to rule them all. However, to extract the data (Unique clusters or any other types), I thought it would be best not to have to modify any VIs. I imagine I make a polymorphic VI, so for any new thing I want to add, I have to copy the same VI and change the data type of the variant to 'data'. I hope that clarifies my intention. I agree that my lack of understanding of the correct procedures and jargon can cause a lot of headaches for you guys, and I apologise. Cheers, M
-
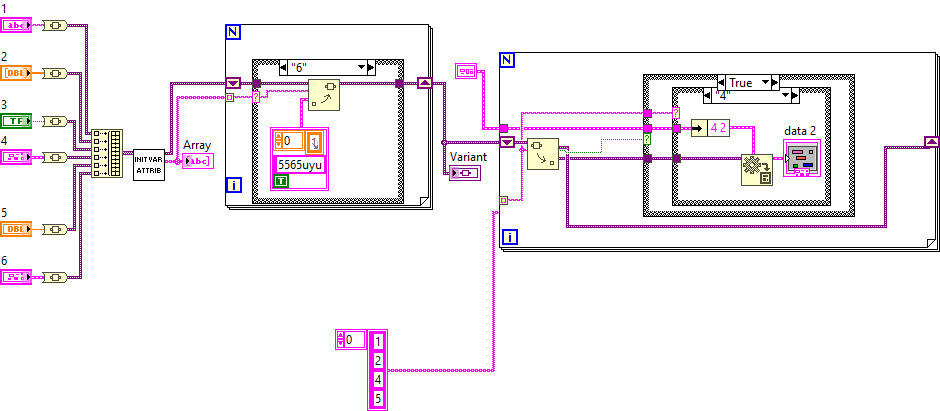
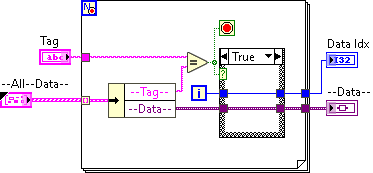
Hi All, this is the VI I am using. Maybe it will be more clear this way. Cheers, M Data Tag.vi
-
Thank you, Neil and Enserge, I agree with you; however, while preparing my app, I realised that every time I needed to add a new function, I had to change data types or add a new cluster, which led to VIs breaking. This was the only solution I could think of to be compatible with every wire time in the terminals. Cheers
-
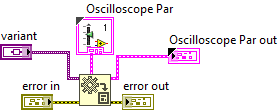
Hi all, In the efforts to Have a clean data wire in my app I am suing a data wire such as this: I Have a VI that reads and gets and reset the data on the wire and am using the RefNum for manipulating or storing the data on the wire meaning I only have a reference wire passed through my multiple loops. To get variant and translate it into my data I decided to use a polymorphic VI and use the type as a data type selector for my convertor: Is this proper or there is better or more efficient way? Cheers, M

-
Hi All, This may be my naivete, but I wanted to know if there is a way to dynamically load the motors (DLLs). Or do I have to load each motor type DLL separately for the front panel (.Net container) of the child class of a motor class? Cheers, M
-
Using variant and set/get attribute
Mahbod Morshedi replied to Mahbod Morshedi's topic in LabVIEW General
Thank you for the reply, Well, I'm very new at Labview, and the software I am developing is for my use. The problem with that is that I know the work and am learning more and more tricks that push me to add more features to the app, and now it has become too big. I am carrying too many unsorted clusters throughout the app that need proper organisation. I also am carrying too many wires in the shift registers (dynamic data, hardware and acq parameters, raw data, copy of the original raw data, worked and formatted data and copy of the original of those for history and undid purposes. I am also adding a completely new experiment to this software, which treats data differently, but the internal would be the same. As you can see, I am out of my depth, and this is a way for me to manage the data across the VIs in different formats and unbundle on the fly based on technique and application. This a the original post I made a while a go that lead me to this decitsion, thanks to ShaunR and the data has gotten bigget since: I was just wondering about the "array with tag" or "Var attribute" since there is not much information about the latter. I am unsure if the data is more susceptible to corruption, gets lost, or if there are other complications I do not know about. Really! I appreciate your reply. It took a while for someone to reply to this one. Cheers, M -
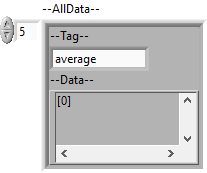
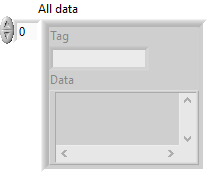
Hi All, I had a question about variant data and variant attributes specifically. I have different datatypes, and for having a nice and neat wiring, I am storing an array of clusters made of a variant and a data tag, so I can insert a new datatype w/o changing anything and with no i/o problems. I use normal search for tag and retrieve data VI, and the same thing for adding new data or changing data. My qusetion was: can i Just use variant attributed to do the same? something like this? Are there any draw backs that I do not know of? Cheers, M
-
Hi Darren, Well, admittedly, it is my lack of experience with programming. I wanted to use one wire to carry all my data, so I made an array of clusters, a variant typed and a tag string' to' and did a tag search to find the data and get the variant. To convert that back to my data, I will have to have the original data type feed to "var to data". I want to get this done programmatically. Case structure is a no-go, so I was thinking of bundling all the data, finding the order of the data via the tag, and unbundling that way. Now, I think it was my naivete, and I should not be so lazy and manually do it when I add a new data type. Cheers
-
Hi. Thank you for putting this together. It is not like this actual unbundle but like indexing an array, using the cluster control order to unbundle the item to get it as a control like unbundle by name does. cheers M
-
Hi All, Is there a way to unbundle a cluster by "order number" instead of name? Cheers, M
-
Using Frame Works in tandem (DQMH and JKI.SMO)
Mahbod Morshedi replied to Mahbod Morshedi's topic in LabVIEW General
@Darren Thanks Darren, Indeed, I've checked your HAL implementation. That was my inspiration, but DQMH does not offer tools for generating Objects. That is why I was thinking to make the HAL with SMO and then using DQMH as you have used but I gather it can become even more complicated. -
Using Frame Works in tandem (DQMH and JKI.SMO)
Mahbod Morshedi replied to Mahbod Morshedi's topic in LabVIEW General
@Neil Pate Thank you Neil, I have already made HAL, I just want to rewrite it (it was my first try and, well, it is messy). But I get your point. Cheers -
Using Frame Works in tandem (DQMH and JKI.SMO)
Mahbod Morshedi replied to Mahbod Morshedi's topic in LabVIEW General
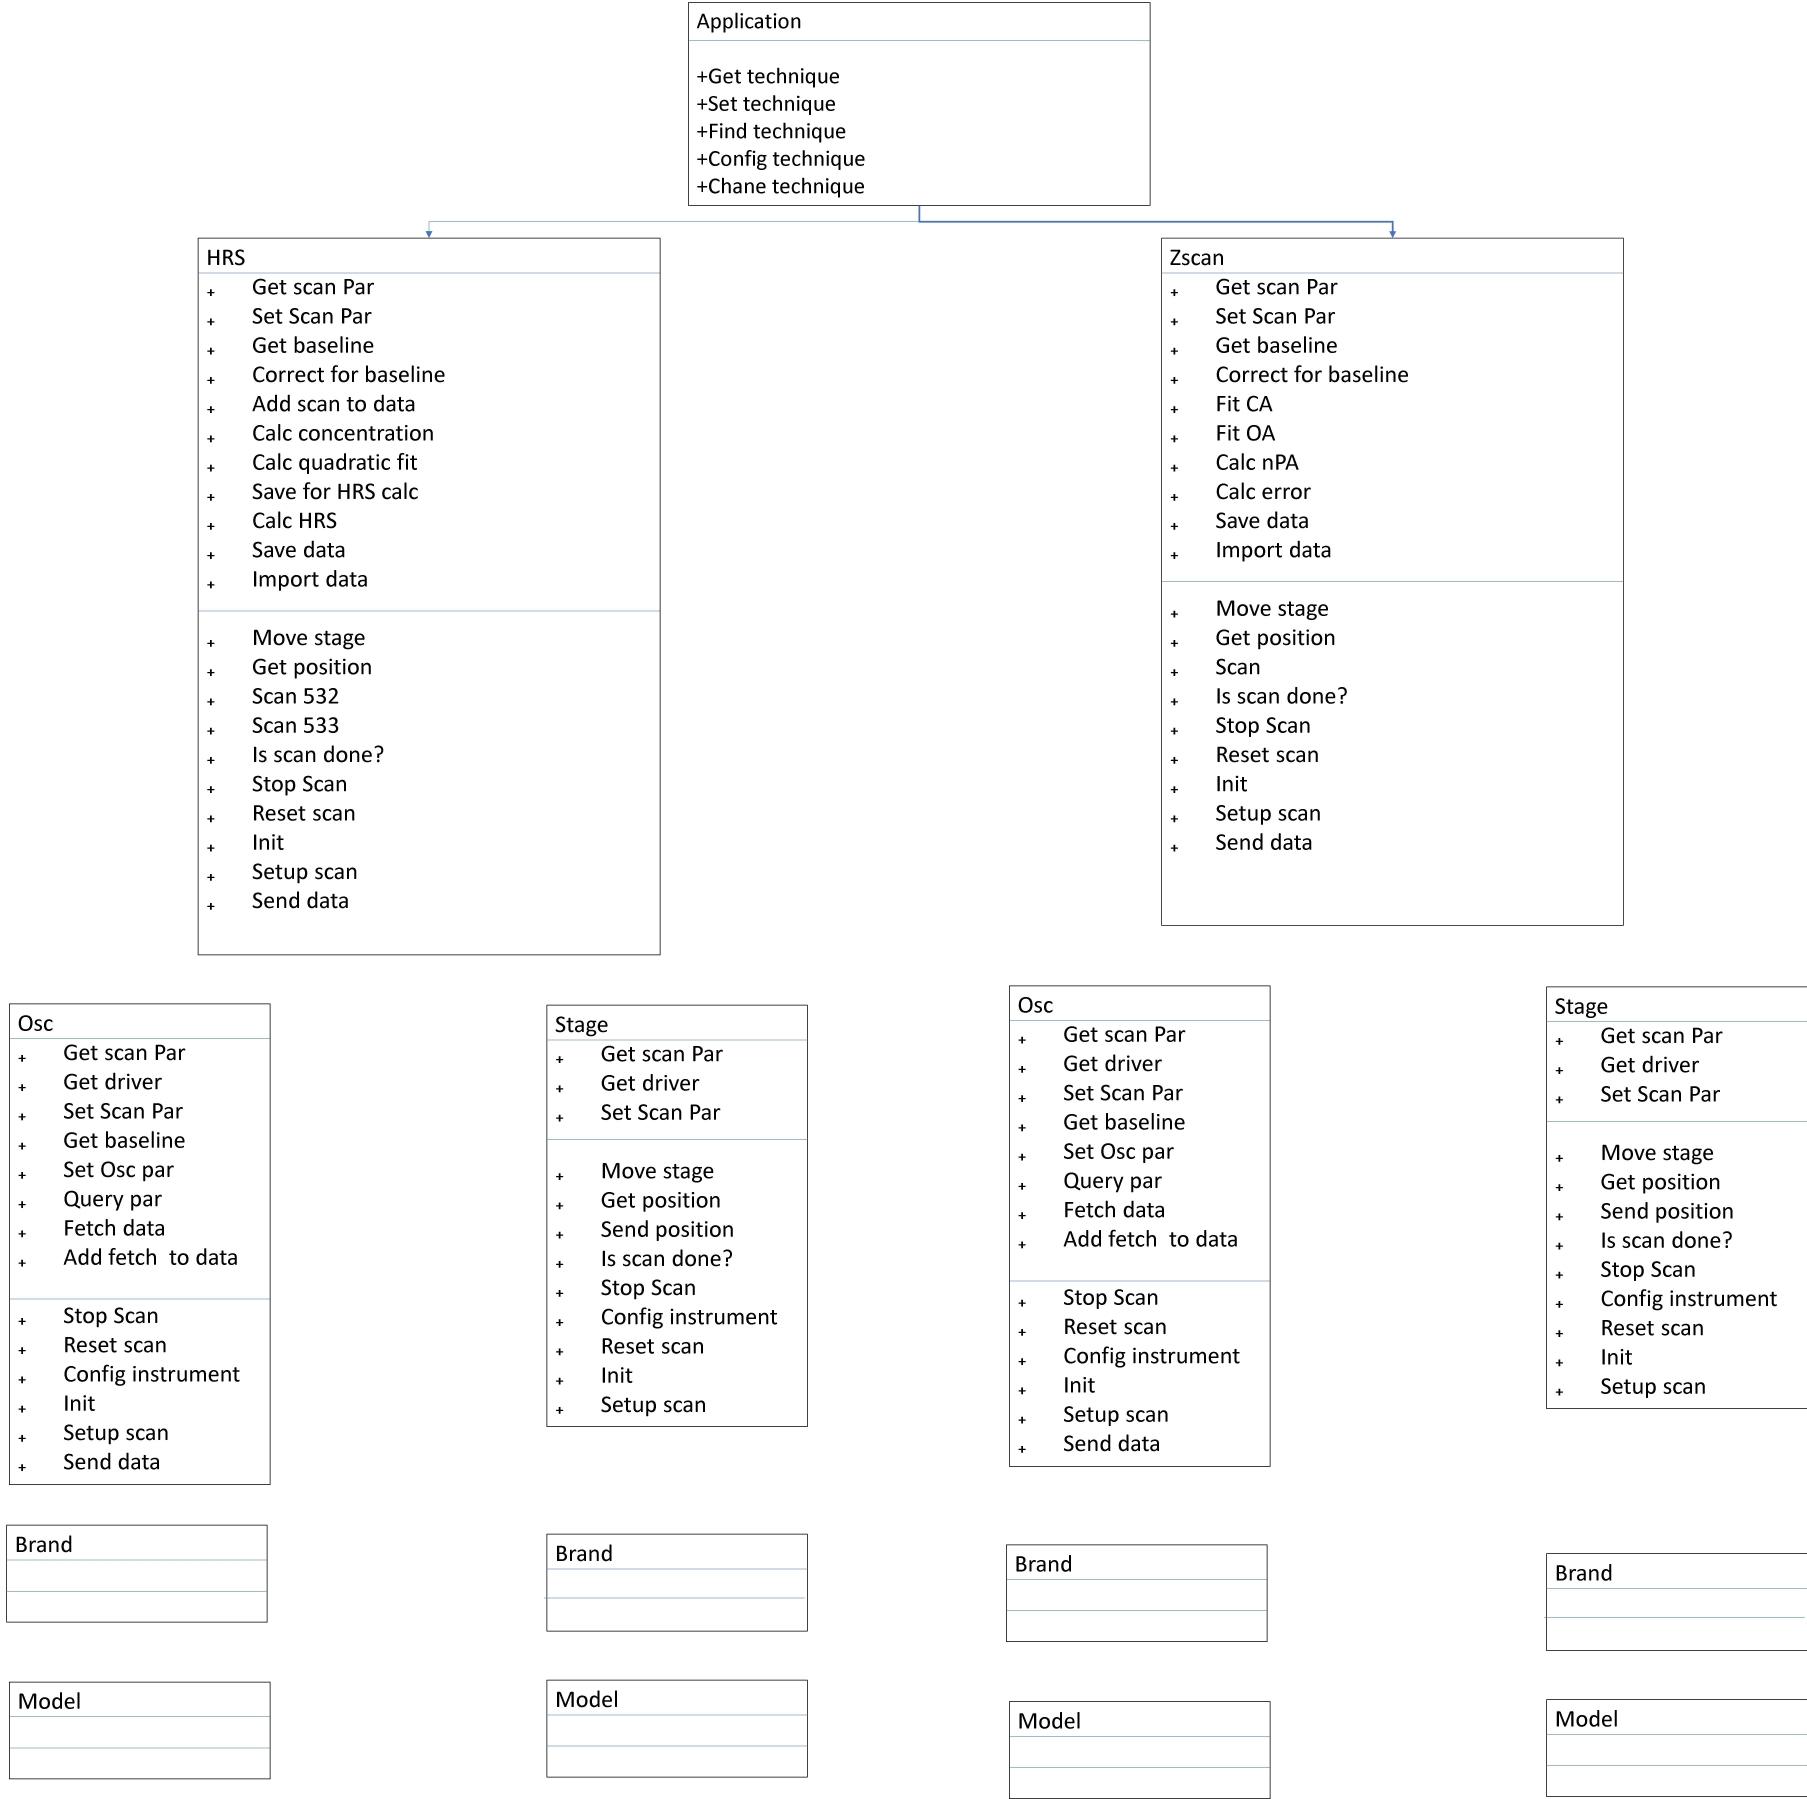
Hi All, Thank you for your help and sorry for confusing things on my part. I am only one person and am still very much new in programming. I am a chemistry researcher who does a lot of laser instrumentation. I have developed two applications for my own experiments and am going to developed some more and wanted away to combine them all in one application since they have a lot of communalities. I was wondering if the best way is to use LOOP and to do that, I thought that SMOs give more formulised frame for writing HAL. Then I was going to Use DQMH for the rest of the software (UI, Workup, Representation, Data save, export and import and anything else that requires inter Module communications). I have attached a very rough UML diagram (Please don't judge too harshly I am not a programmer; it is done in PowerPoint and right now). So, I was thinking if it is a good approach or should I stick only to one. Bear in mind that I am using the project to also learn LabVIEW. Cheers, MM
-
Hi All, Is it possible use JKI>SMO to generate my classes and then use those classes in DQMH? And also, is it even a good idea to mix and match this way. Cheers, MM
-
Merging graph legends or selectively hiding legends.
Mahbod Morshedi replied to Mahbod Morshedi's topic in LabVIEW General
Well. I'm not sure if this was the best way but it is working perfectly thank you again. -
Merging graph legends or selectively hiding legends.
Mahbod Morshedi replied to Mahbod Morshedi's topic in LabVIEW General
Thank you I will give it try and see if it is working and the right solution. MM -
Merging graph legends or selectively hiding legends.
Mahbod Morshedi replied to Mahbod Morshedi's topic in LabVIEW General
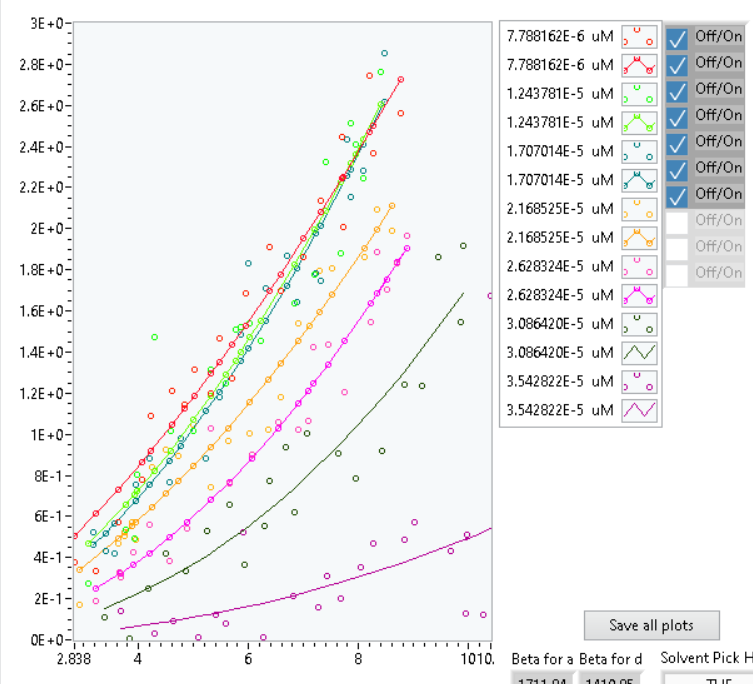
HI BramJ, thank you for the solution, tut that would not work for what I need, as you see I had to add a separate one and off for my plots that is used to select the selected plots for further calculations. I wanted to replace this Booleans with the plot is visible on legend and use that property in its place. Wich in you solution is a little (programmatically) more work that it is worth. Cheers, MM -
Merging graph legends or selectively hiding legends.
Mahbod Morshedi replied to Mahbod Morshedi's topic in LabVIEW General
Hi X__, I am not quite sure I understand dummy graph. Do you mean the graph is going to be nit visible? and I use that only for the legend? Cheers -
Merging graph legends or selectively hiding legends.
Mahbod Morshedi replied to Mahbod Morshedi's topic in LabVIEW General
Hi Sam, I understand what you say and that exactly how I generate my graph (I programmatically assign colour line style point style and legend label). The problem is this graph is a combination of two sets of plots: As I said, scatter plot (points) and fitted (lines) plots. In other words, every two plots belong to the same data. Problem is that I cannot find a way to only show one legend for both plots or away to combine the two plots and show as one plot group. Also, visible apply to plots not the legend for that plot. My question is if there is a way to hide every second legend (not plot) and only the legend. I have tried the legend properties, but the visible property is applied to the whole legend rather than my specified plot legend. Cheers, MM -
Hi All, I'm not sure if what I need is even possible in LabVIEW. As you can see in the pic, I have a scatter and fitted data presenting in the graph. What I really need is a way to show only legend for one since they are coupled and not independent. I was thinking it is possible either by somehow combining them or turning off the legends for one but so far, I have not been successful. I was wondering is there a way to achieve that? Cheers,
-
Thank you ShaunR, That variant looks promising, and I will give that a try a try. I could also use a user even framework such as JKI state machine or DQMH. Any good material you can suggest for me to start with GOOP would be appreciated in the meantime. Cheers Mahbod
-
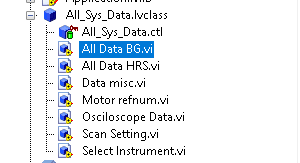
I totally Agree and in fact i had that format originally. However, arrays gets rid of the cluster names and replace them wit the first item's name and for me keeping track was becoming difficult even with documentation. it was just easier to have the clusters that can have different name. I know that i could also use a simple enum for indexing but that would add an extra data that needed to add to my system. I also have a duplicate of BG and HRS as an original data and manipulated data. This way when want i can revert back by replacing the data with the original. I am very new to programming and do not have experience in data organisation and almost nothing about labVIEW classes and the NI documentation is just too simple and is not covering any real life application. That is why I was asking for help. Cheers,
-
Thank you both for your comments, I undrersatnd that my dta organisaion is a mess here. however i use these almost every where and wanthet to use only one wire across. I am not sure if there is a better way to do that since that can programatically change or vis UI. That is why I wanted to use a class to help me with ubn and bbn of the cluster data. Cheers,
-
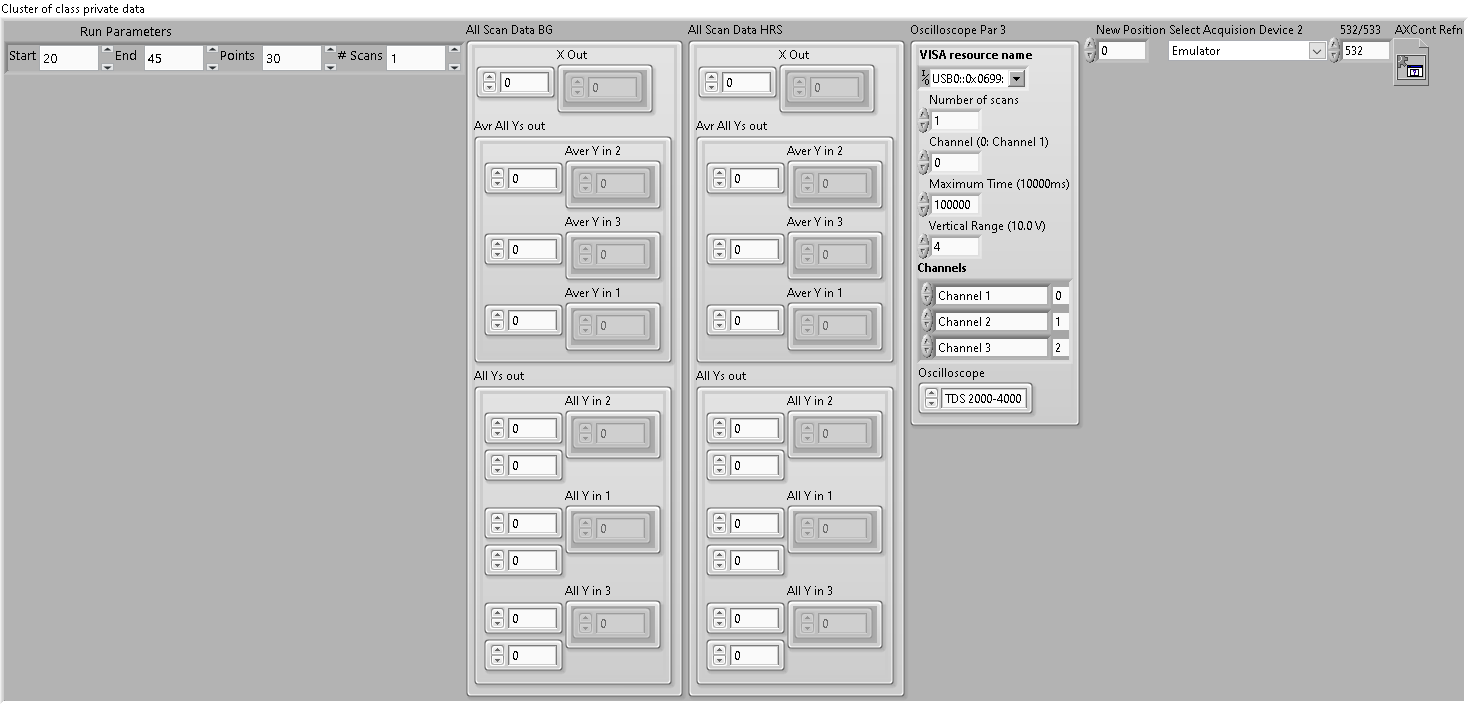
Hi All, I am currently facing some challenges with my application for data acquisition and processing. Specifically, the data cluster in the system has grown quite large, making it difficult for me to manage, especially when I consider adding new features. I have heard that converting everything to a class is the best approach, but I am unable to find any suitable resources or examples for it. Most of the available information pertains to simple and uncomplicated data types. Can anyone please guide me towards the appropriate resources or provide an example? Thank you, P.S. The data cluster in question is the subject of my inquiry look like this: and this is the class I atempted: