Guru Prasath
-
Posts
4 -
Joined
-
Last visited
Content Type
Profiles
Forums
Downloads
Gallery
Everything posted by Guru Prasath
-
 sorry for asking do you share any basic code for this doubt
 -
Hi Bryan, This post is also same i will post this same doubts in Ni community also. https://forums.ni.com/t5/LabVIEW/How-to-edit-the-element-value-of-the-2d-array-of-string/m-p/4207337
-
I do not edit the element value of the 2d array of string indicator While Vi is in run condition how to edit 2d array of string indicator (only array control is easy to edit the element value While Vi is in run condition.) I need this requirement for my report generate project. Anyone knows this concept Please Comment on me. Thanks & Best Regards.
-
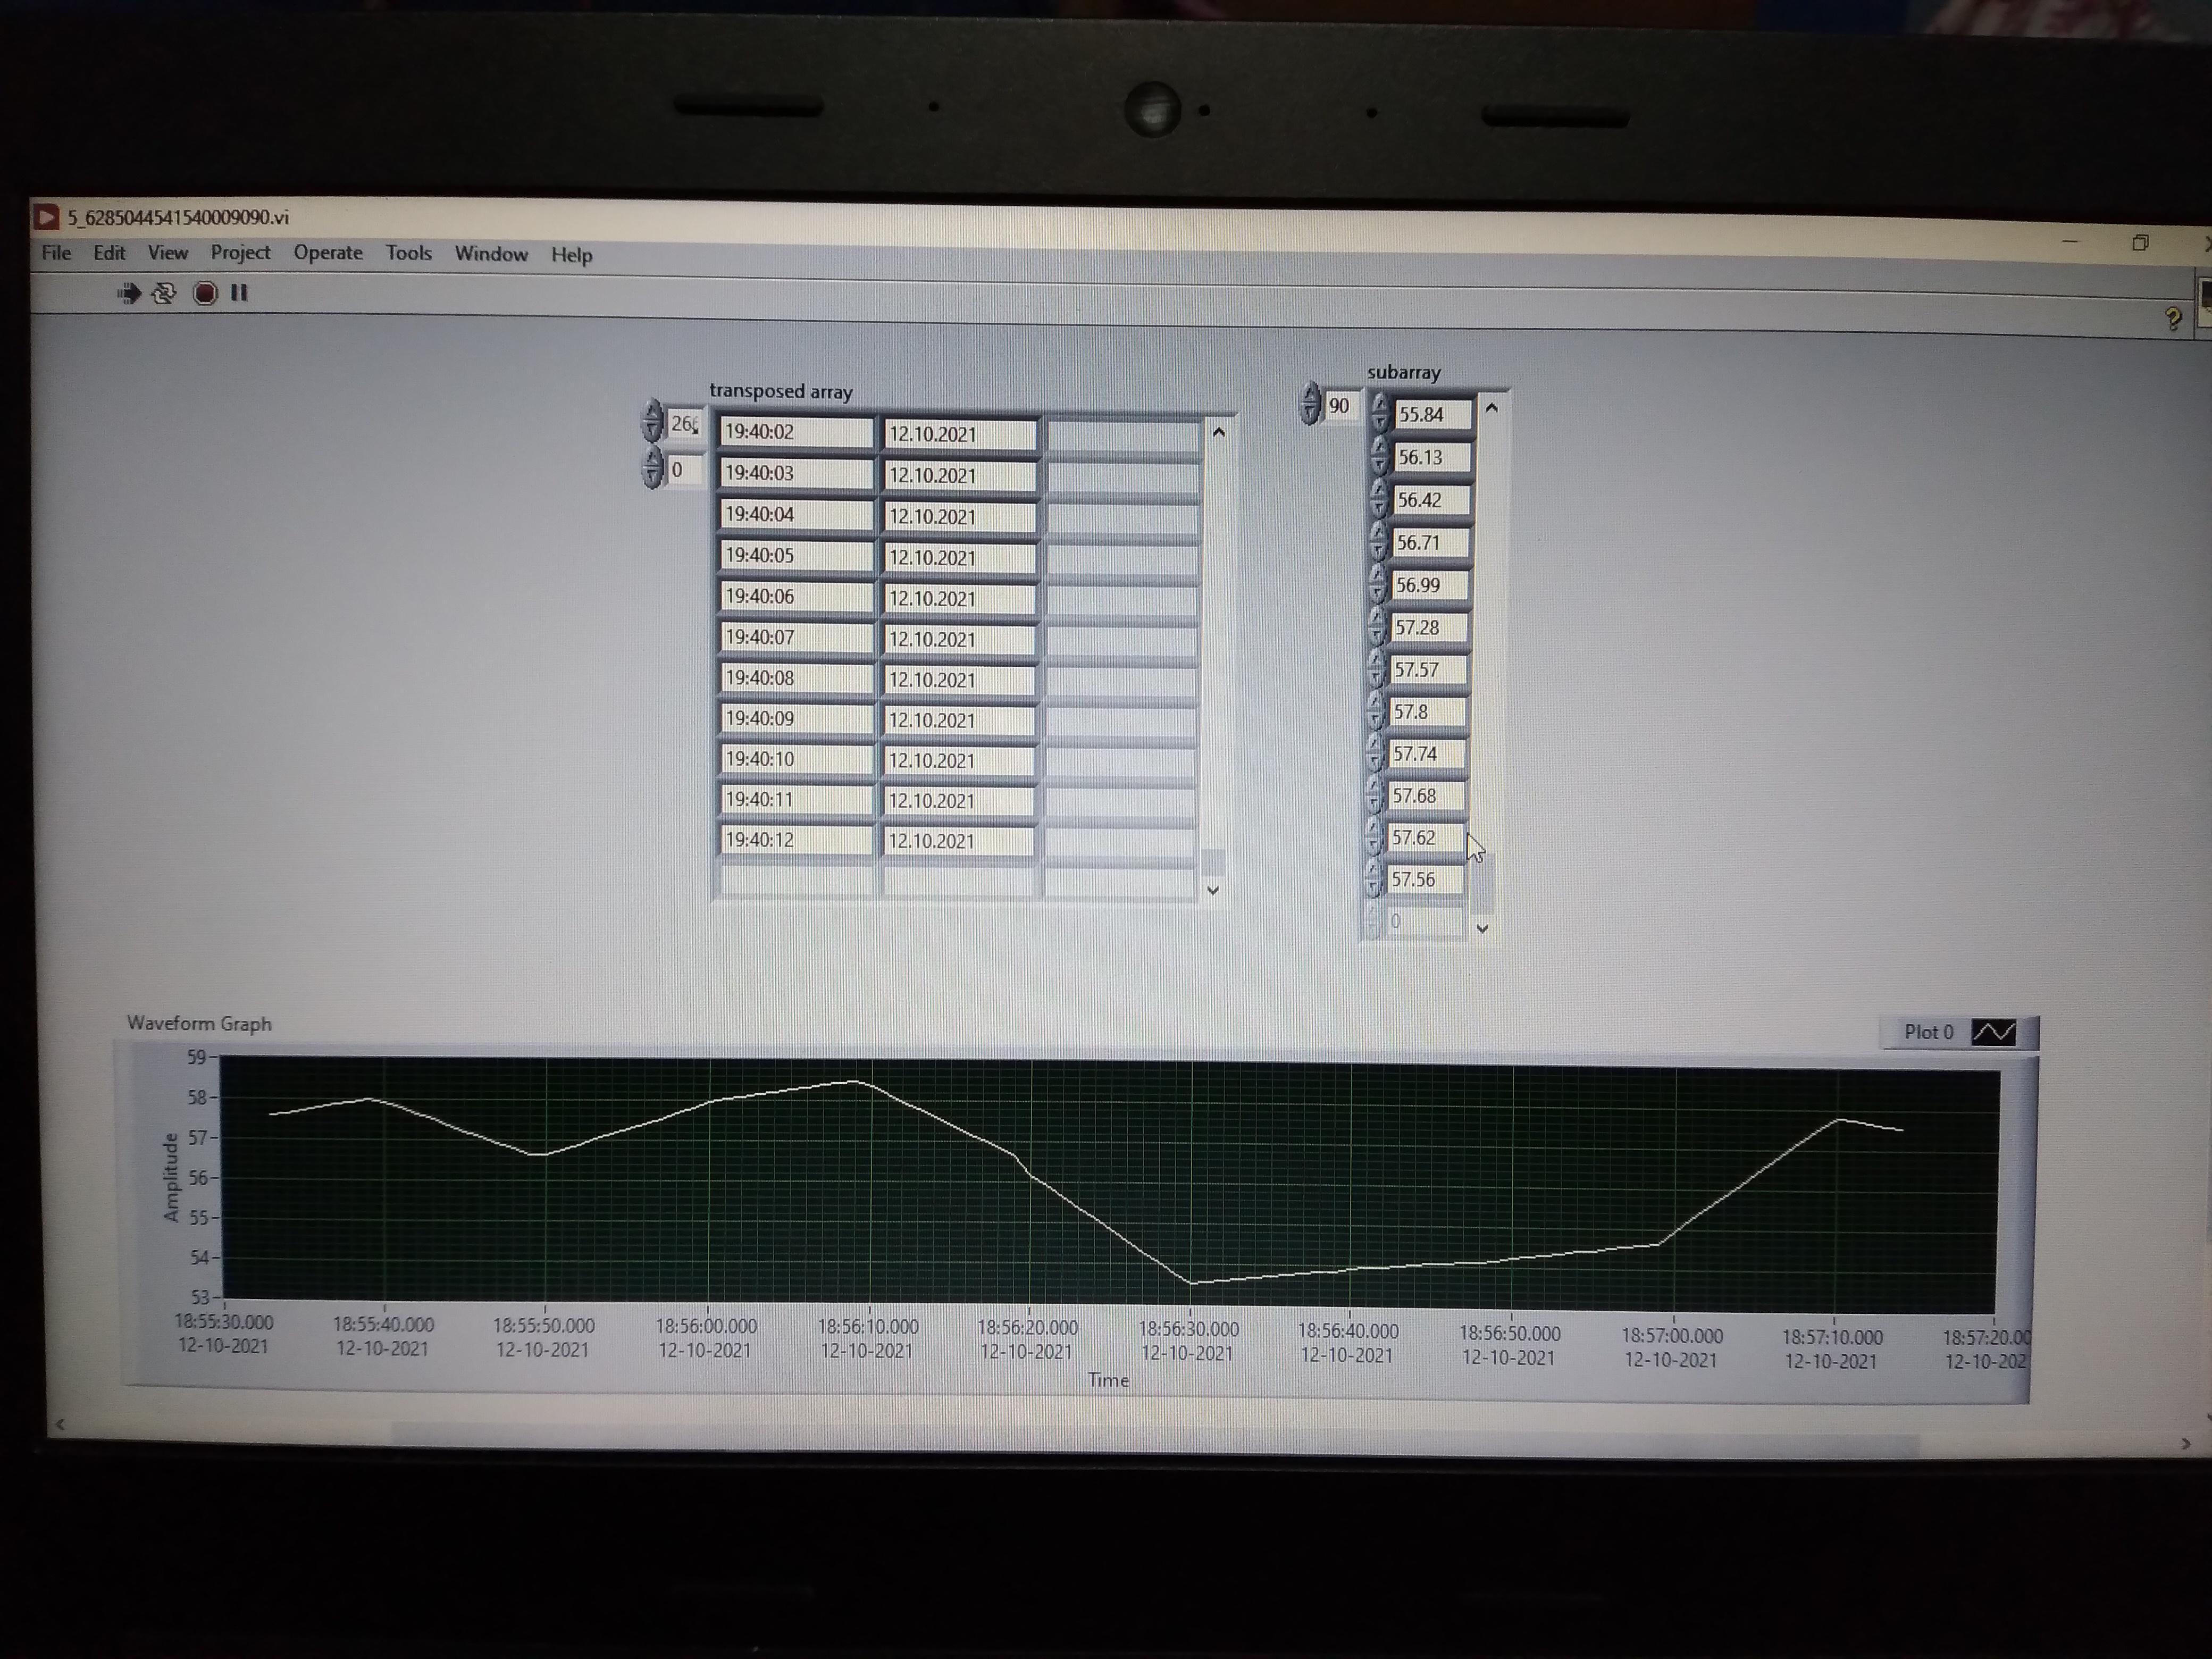
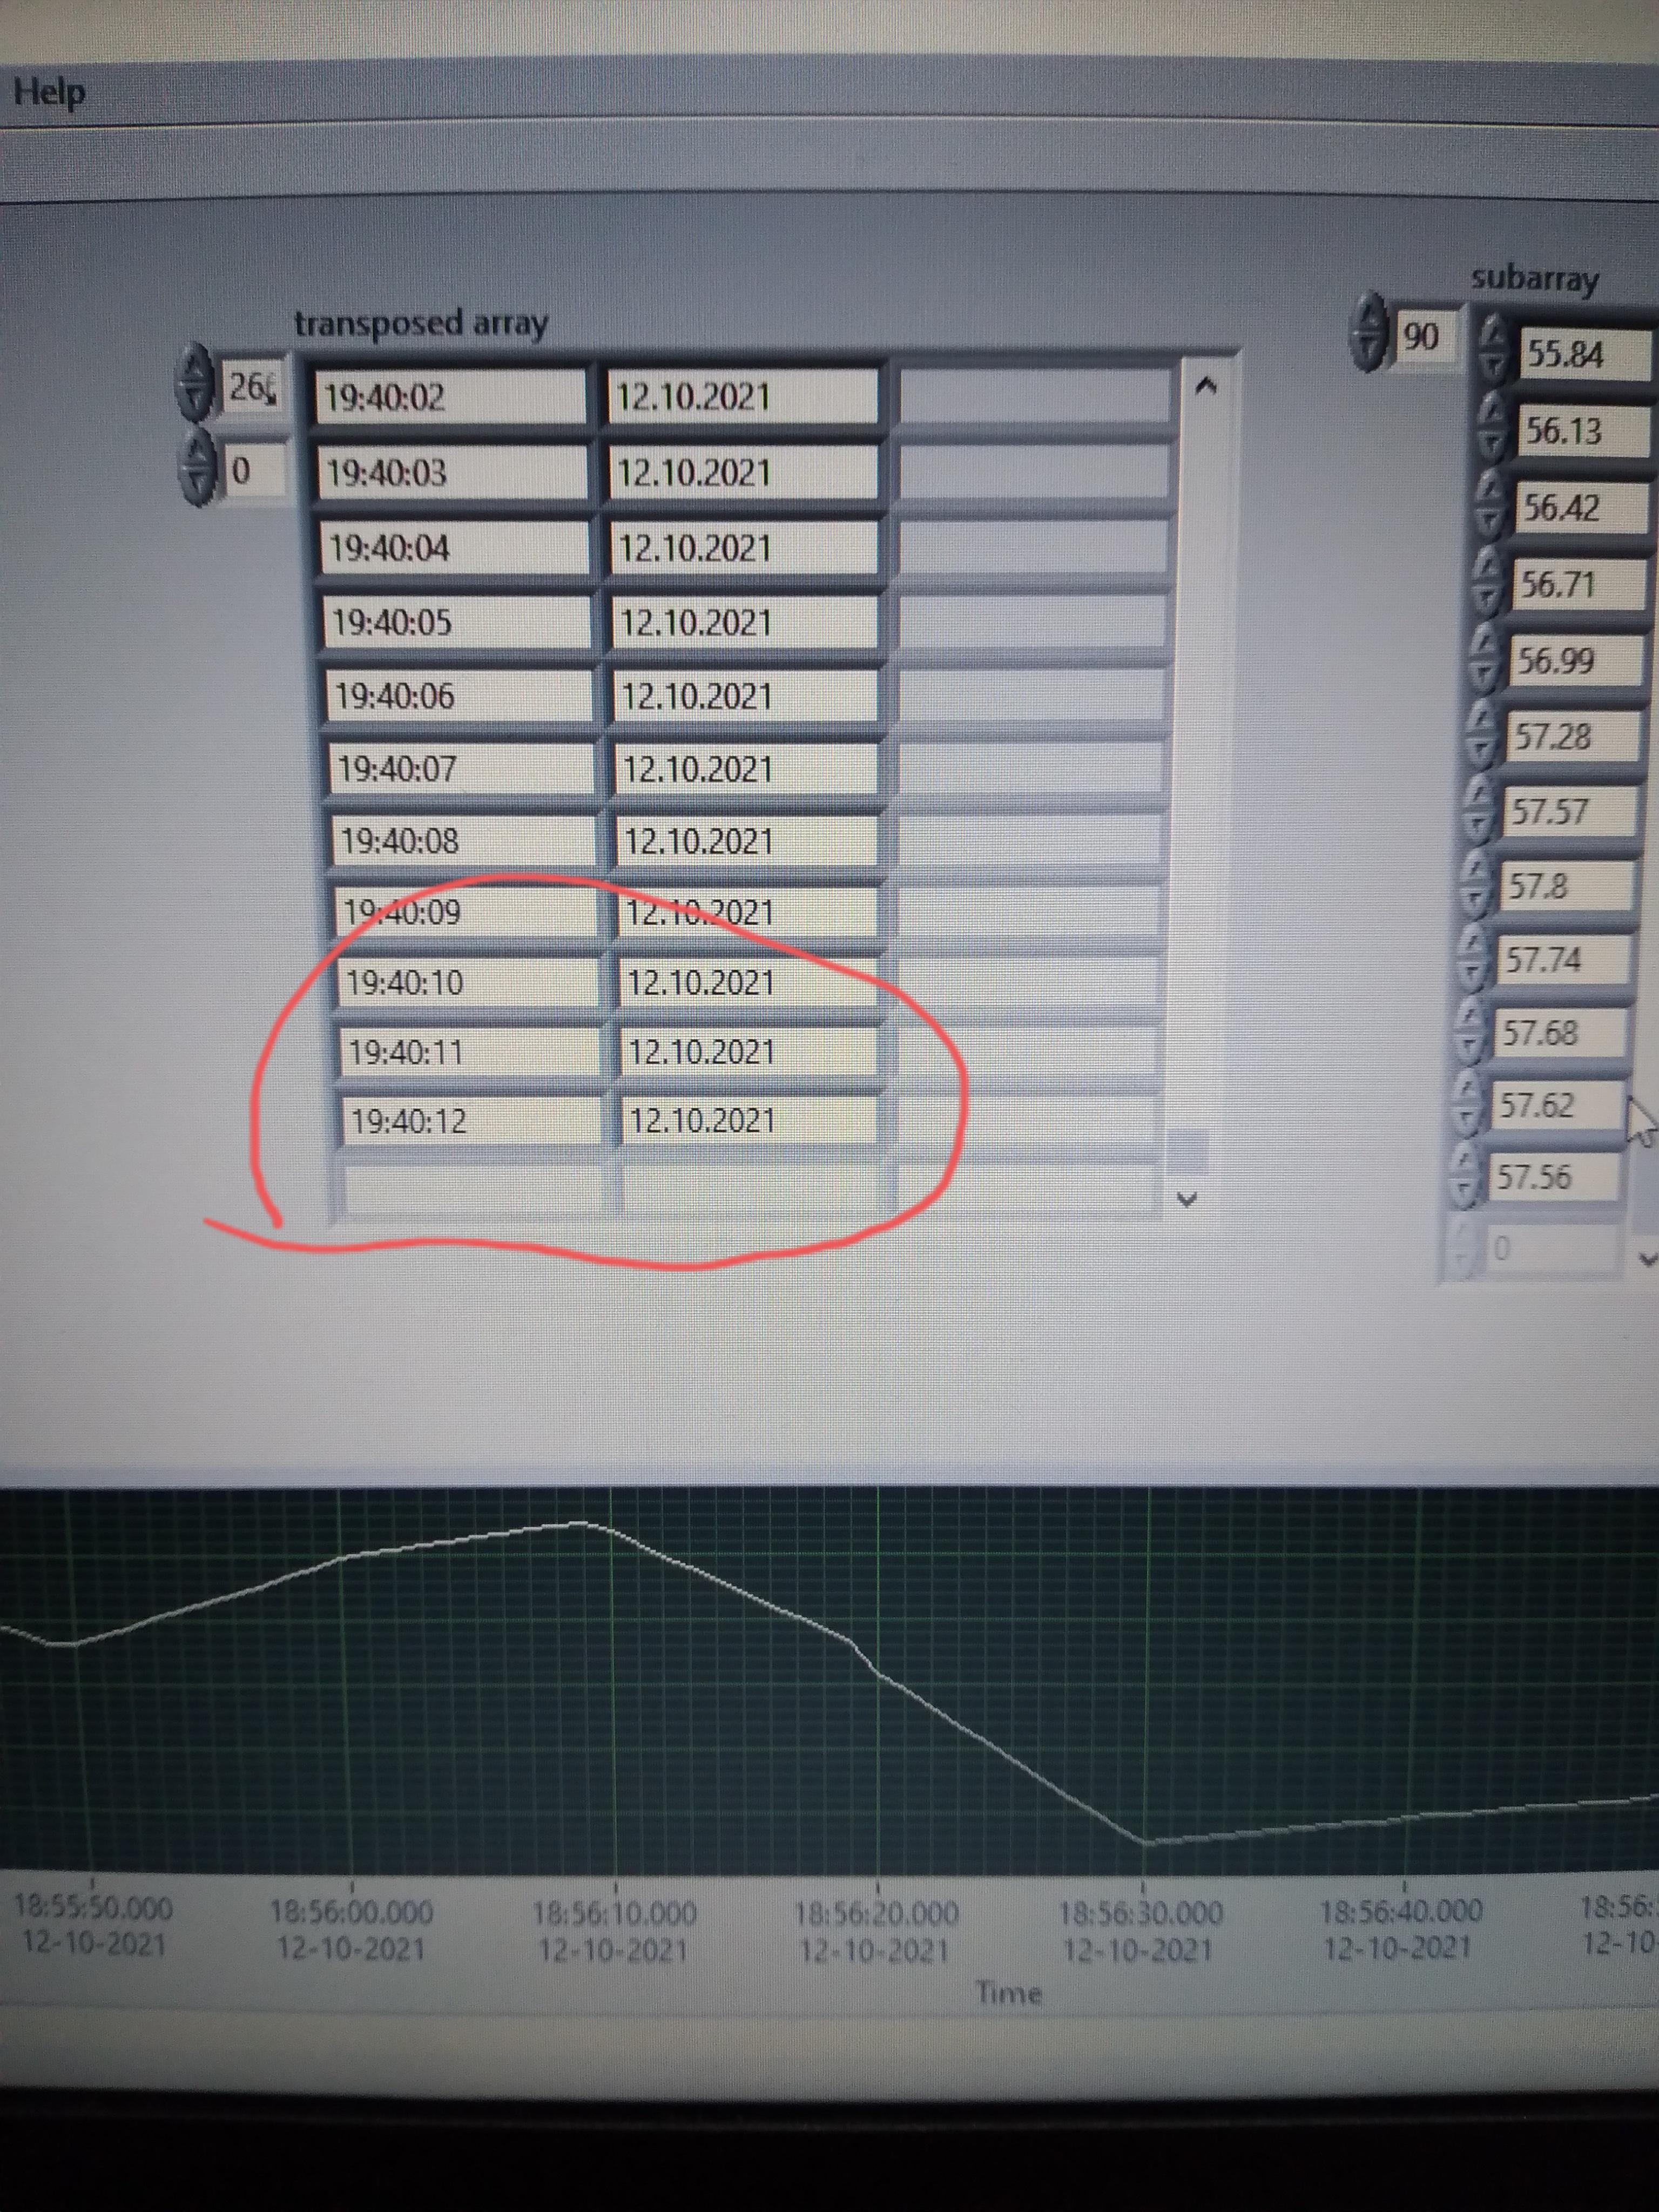
Hello Everyone; How I plot the timestamp in the graph of the x-axis and numerical slider the timestamp given in 2d array. The array in 2d array of string... I will try this but it not plotting full timestamp can you help me to short of this problem. It will be a plot, but a few timestamps will plotting How I plot full timestamp and date... I have attached my problems like the jpg file and .vi file for your reference. Does anyone have solution comments below... 5_6285044541540009090.vi Thanks and Best regards...